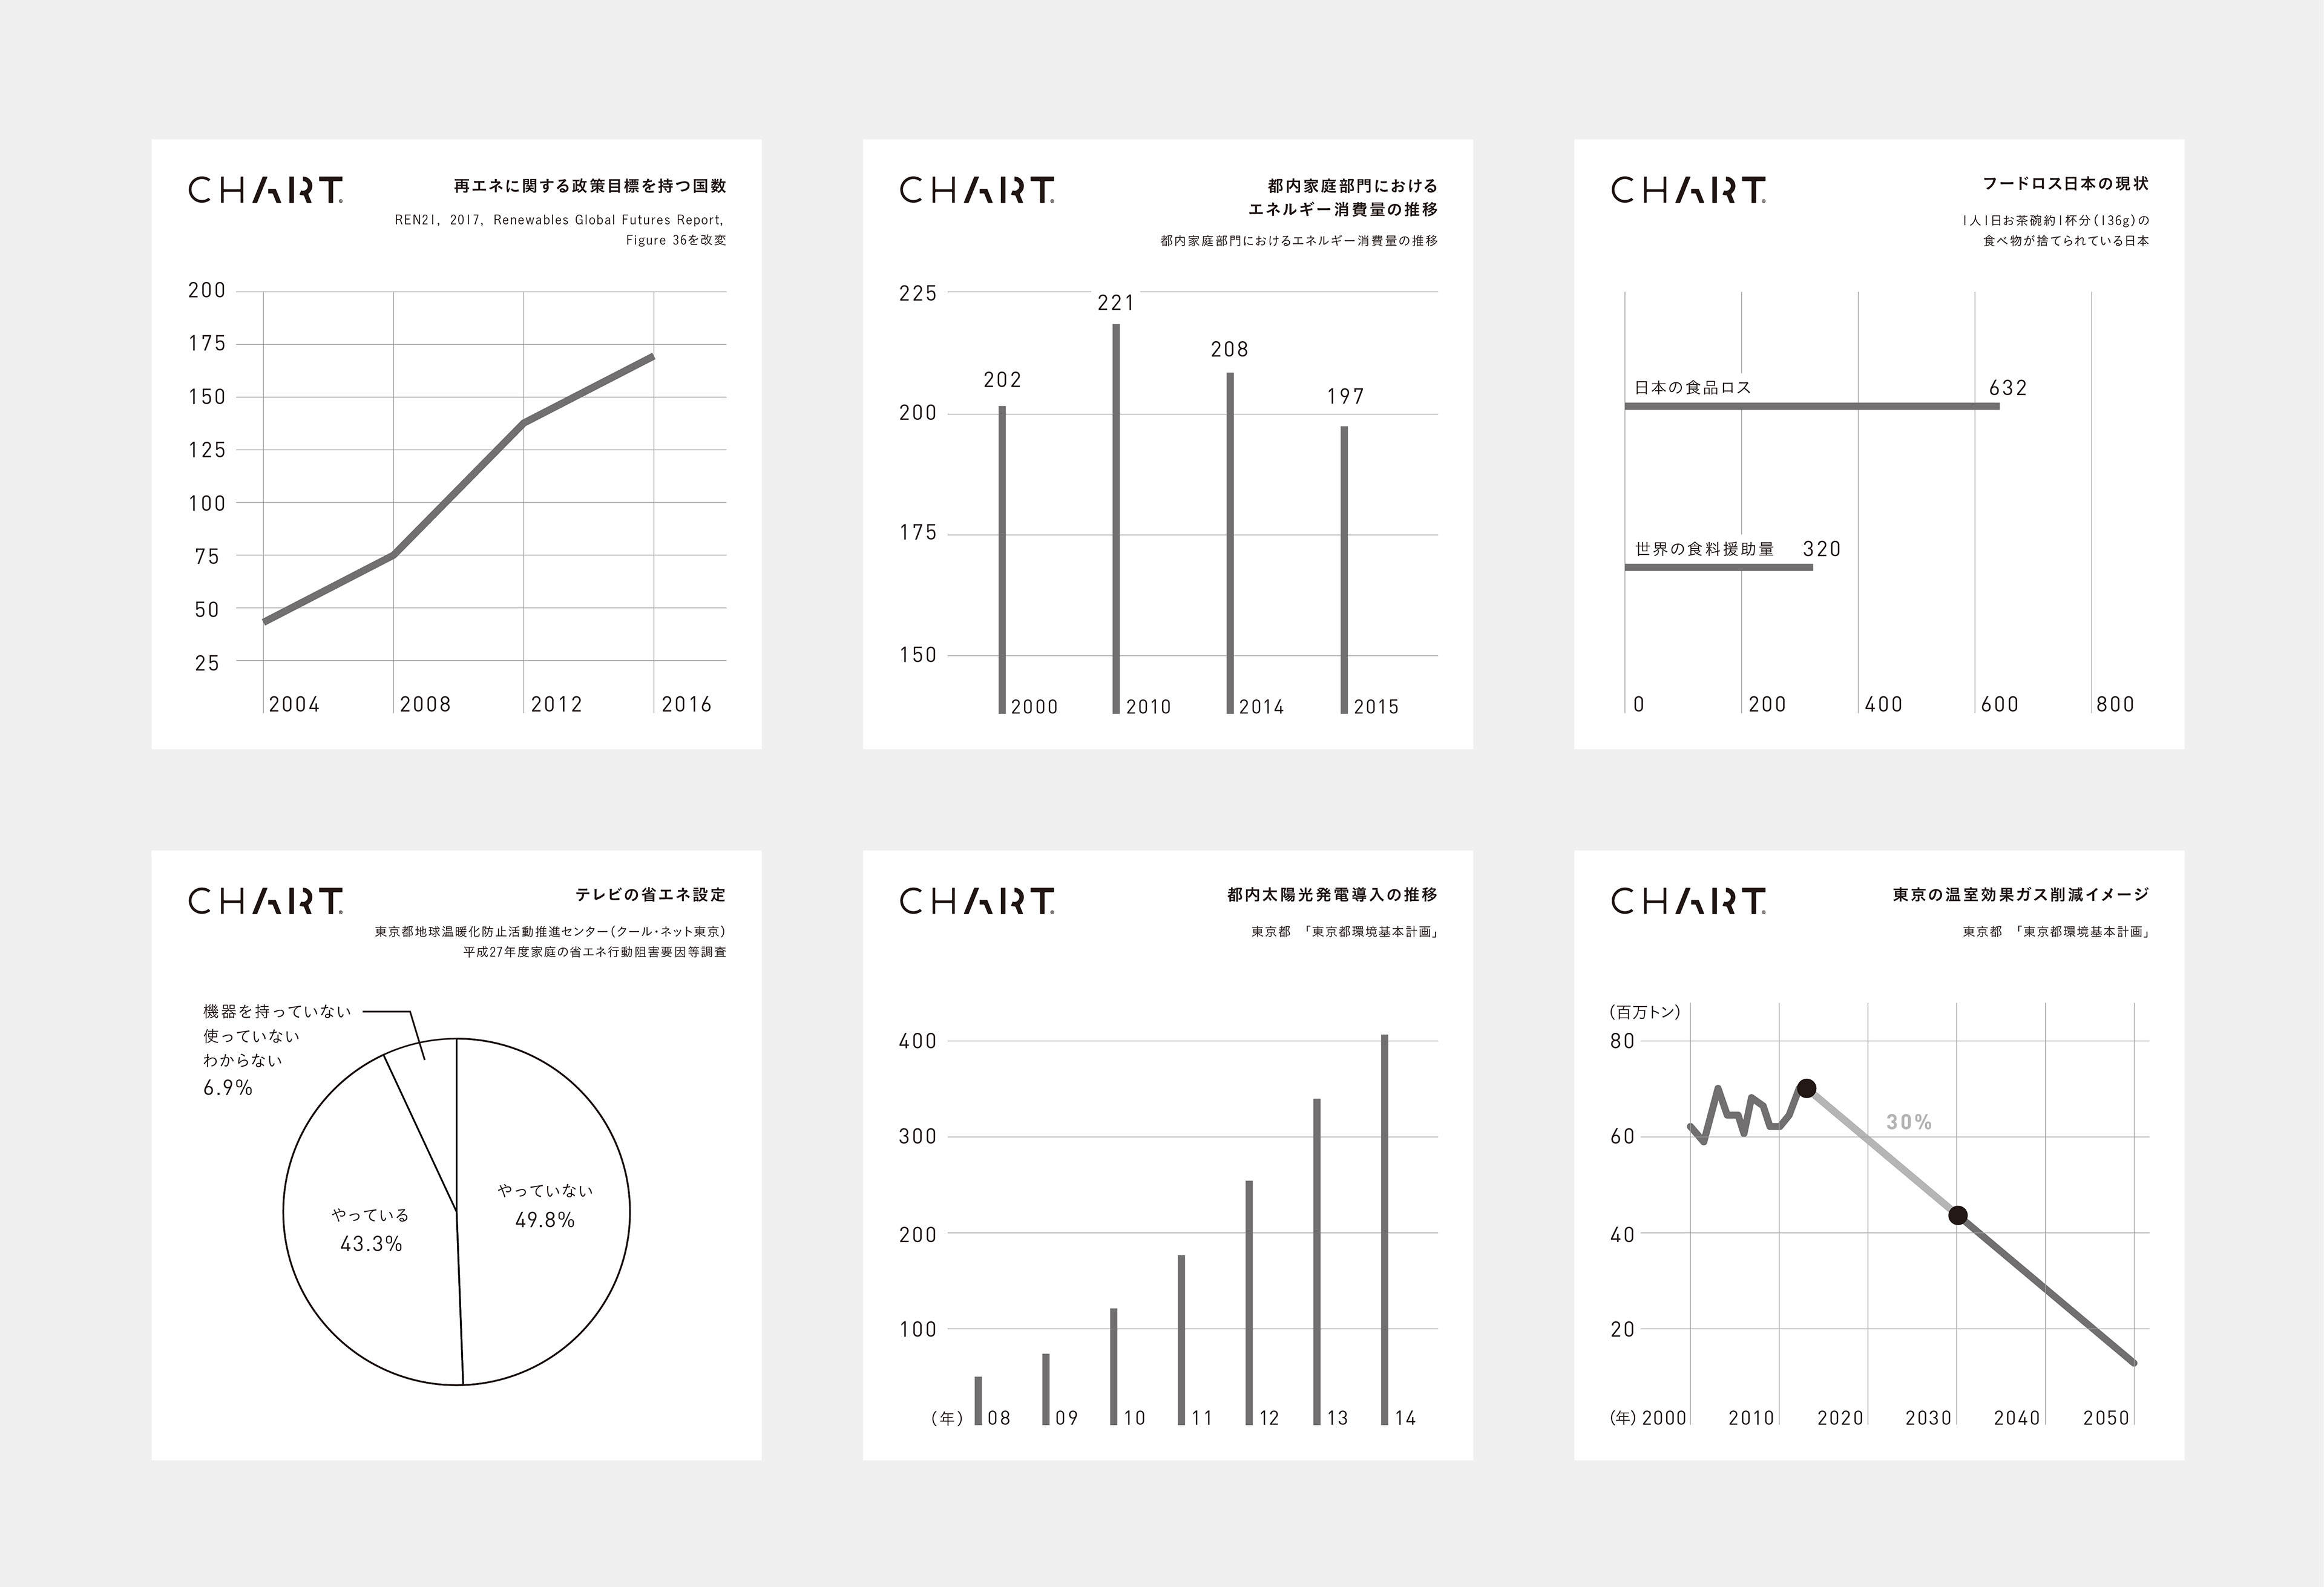
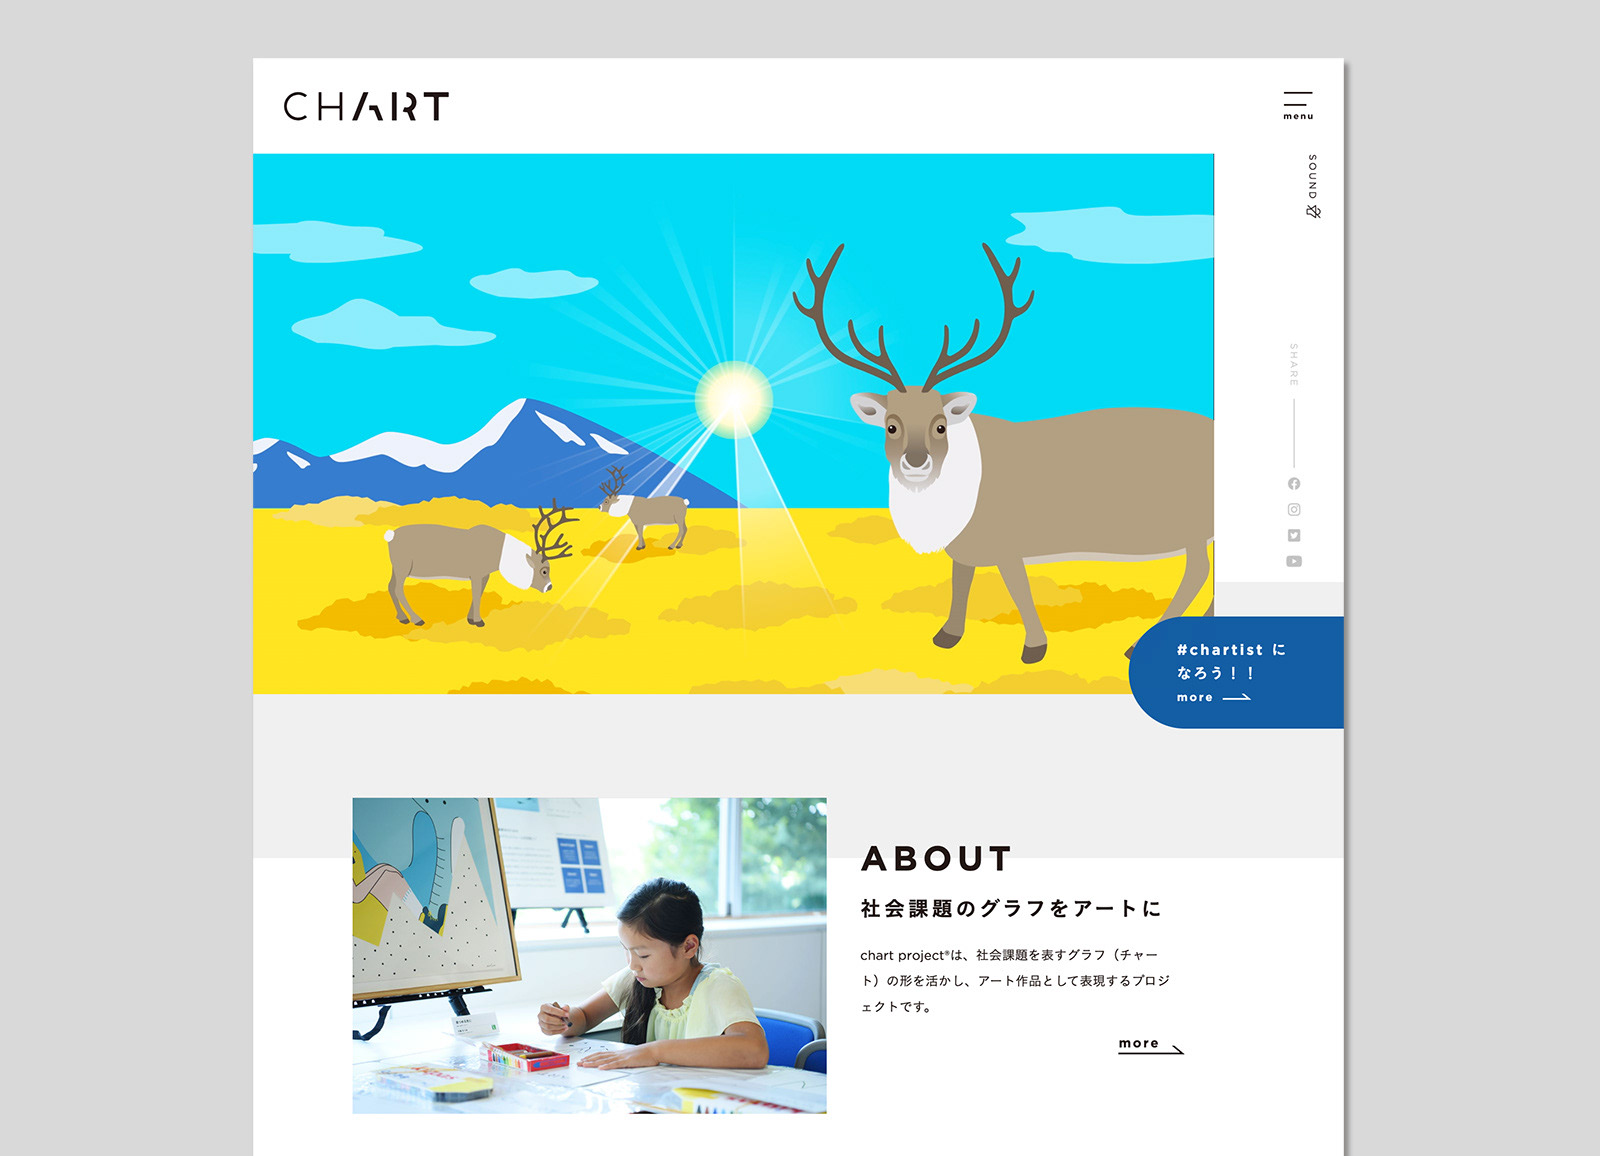
chart project®は、社会課題を表すグラフ(チャート)の形を活かし、アート作品として表現するプロジェクトで、現在の社会課題データと、その課題が改善された理想の未来を、アート作品を通して多くの人に届けるプラットフォームです。社会課題の事実やデータを、「勉強」としてではなく、アートとして身近に感じてもらい、一人でも多くの人が自分の課題として社会課題をとらえ、その解決のためのアイディアを創造してほしいという思いから、ひとしずく株式会社のこくぼひろし氏により2017年に始まりました。
tegusuでは発足時からchart project®におけるコミュニケーションデザイン、クリエイティブディレクション、デザインを通してプロジェクトをサポート。現在は代表の藤田が一般社団法人チャートプロジェクトの理事として活動しています。
The chart project® is a project that utilizes the shape of graphs (charts) that represent social issues and expresses them as artworks. It is a platform to deliver data on social issues to as many people as possible through artwork.
The project was launched in 2017 by Hiroshi Kokubo of Hitoshizuku Corporation with the hope that by making the facts and data on social issues accessible as art, rather than as "studies," as many people as possible will see social issues as their own issues and create ideas for their resolution. It was started as a way to promote the development of the company's products and services.
The project was launched in 2017 by Hiroshi Kokubo of Hitoshizuku Corporation with the hope that by making the facts and data on social issues accessible as art, rather than as "studies," as many people as possible will see social issues as their own issues and create ideas for their resolution. It was started as a way to promote the development of the company's products and services.
Since its inception, tegusu has supported the project through communication design, creative direction, and design for the chart project®. Currently, our representative, Fujita, serves as a board member of chart project®.

Exhibition
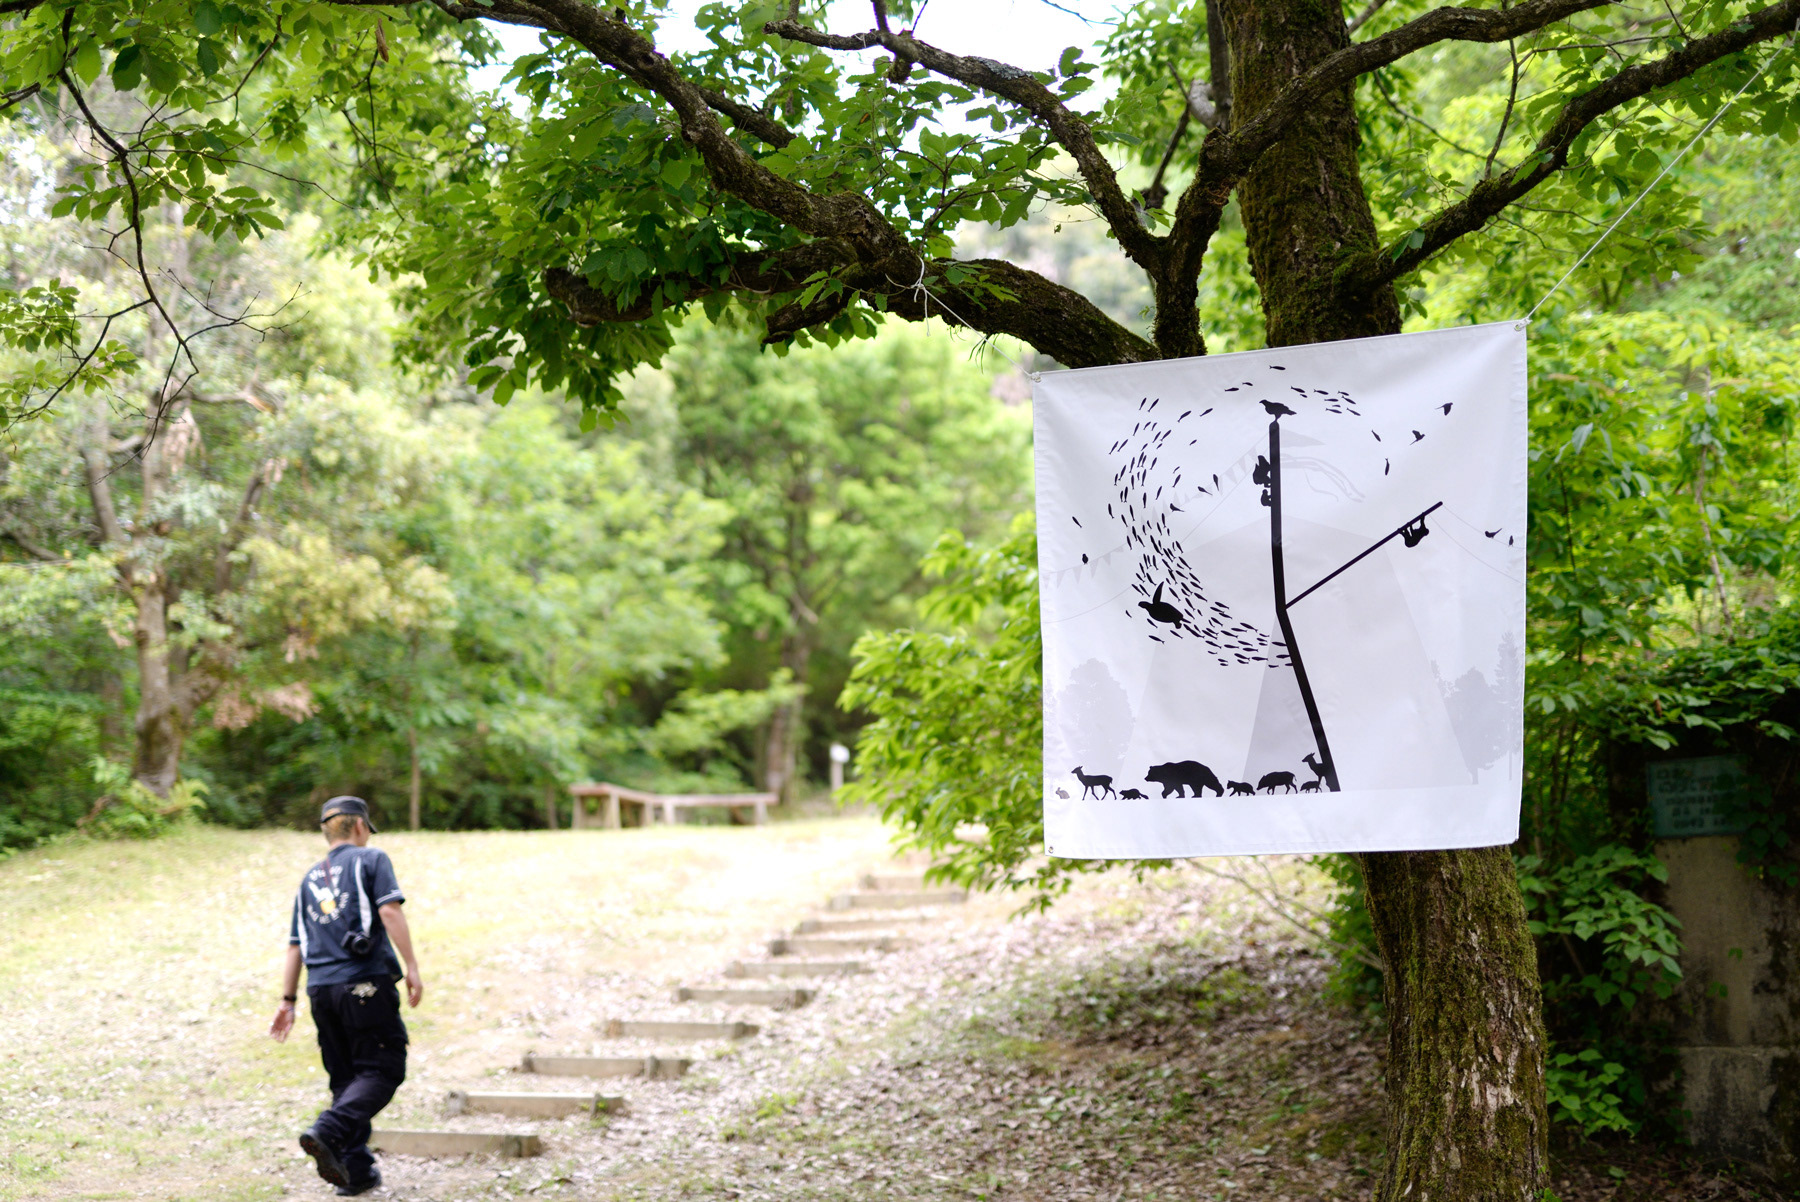
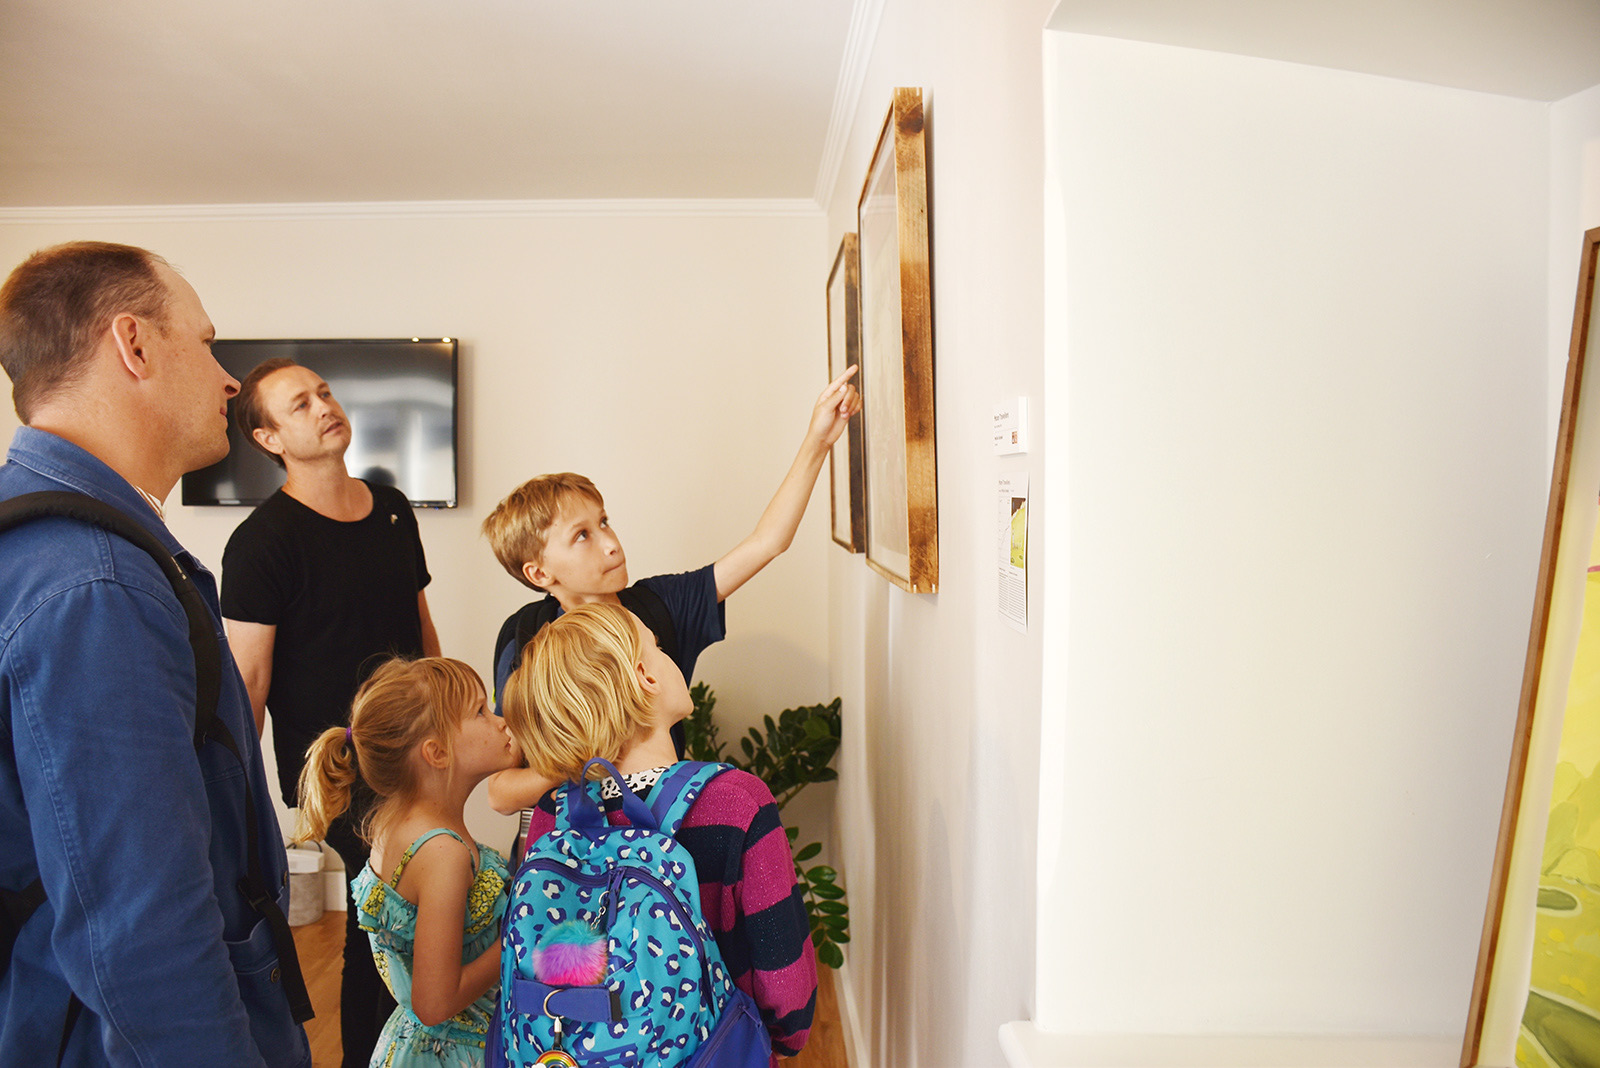
chart project®ではこれまで、さまざまなアーティストやデザイナーとコラボレーションをし、展覧会を通して社会課題グラフの存在を伝えてきました。石川県MISIAの里山ミュージアムにおける野外展示を皮切りに、大阪、東京、そして初の海外となるスウェーデンまで、各地で活動を広めています。NHKプラスクロス渋谷では、国内外で活躍するアーティストとともに制作した作品の展示も行いました。その他、自治体や企業とともにさまざまイベントに出展をしています。
chart project® has collaborated with various artists and designers to communicate the existence of social issue graphs through exhibitions. Our first exhibition was held in a forest. Since then, we have been spreading our activities to Osaka, Tokyo, and Sweden, not only in Japan but also to the world. For the exhibition at NHK Plus Cross Shibuya, we worked with artists active outside of Japan, such as wisut ponnimit. In addition, we have exhibited at various events with local governments and companies.


MISIAの里山ミュージアム展示 Exhibition Director & Designer : Kenji Fujii


大阪府立江之子島 文化芸術創造センターenocoにおける展示 および 東京/TAMBOURINE GALLERYでの展示

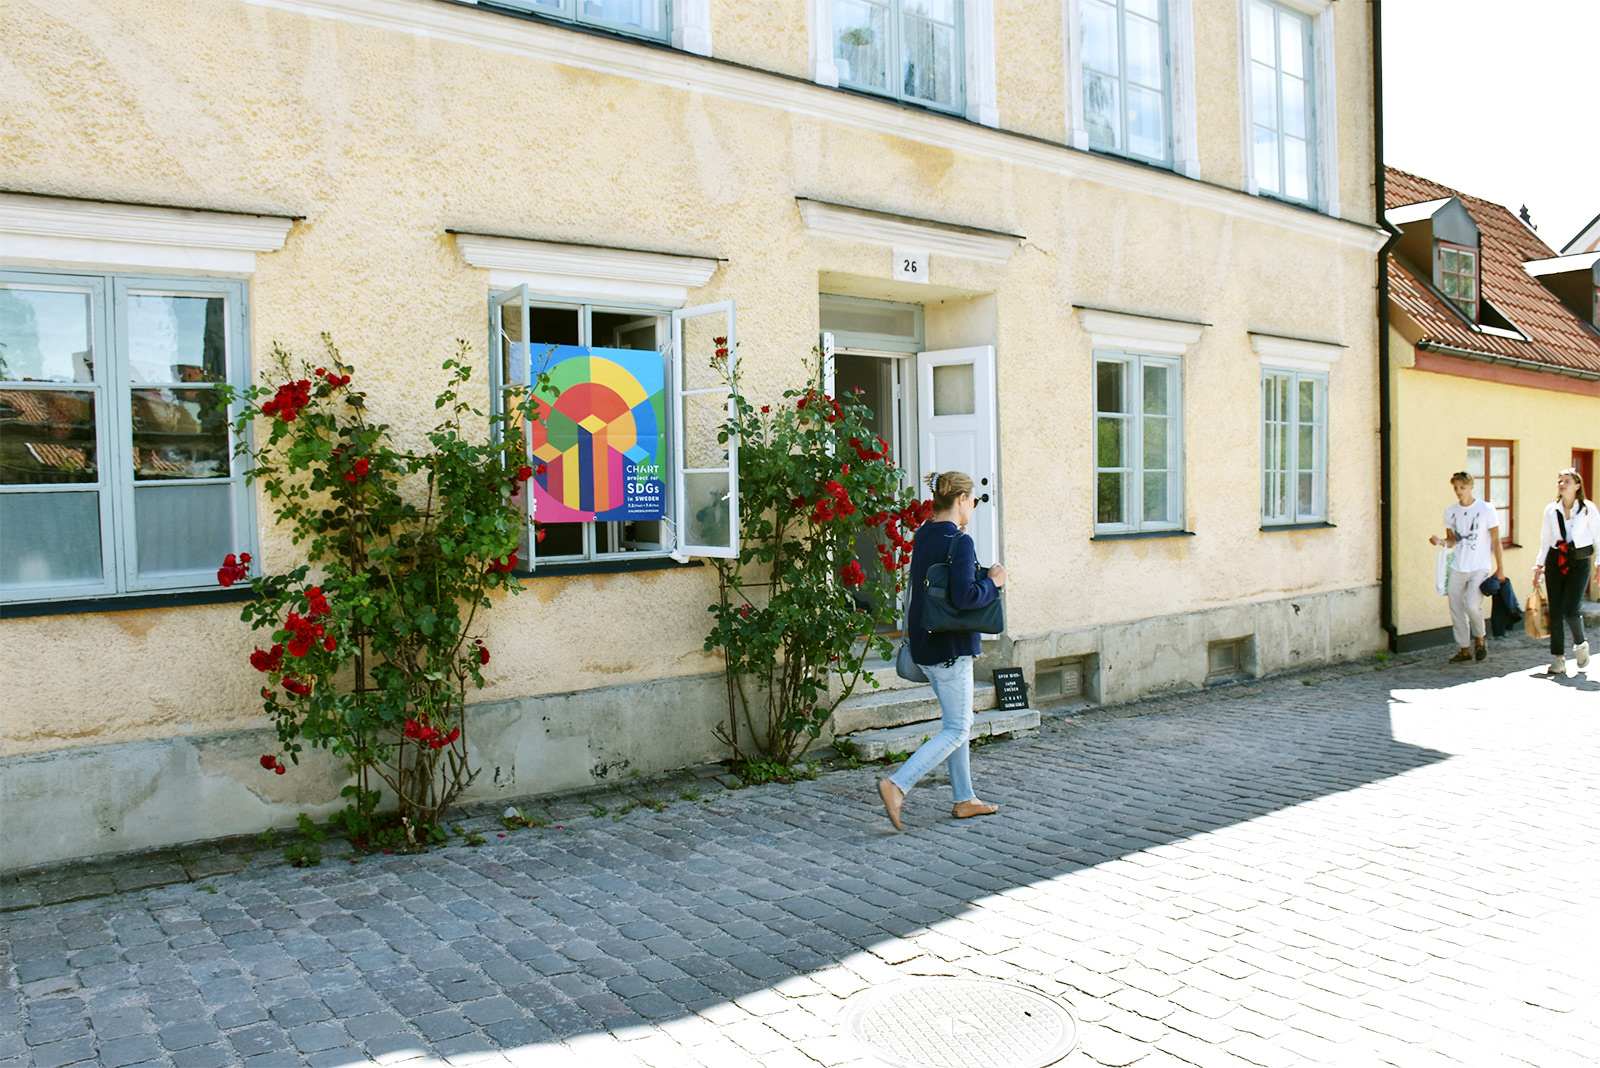
スウェーデン・ゴットランド島におけるchart project for SDGs in Sweden
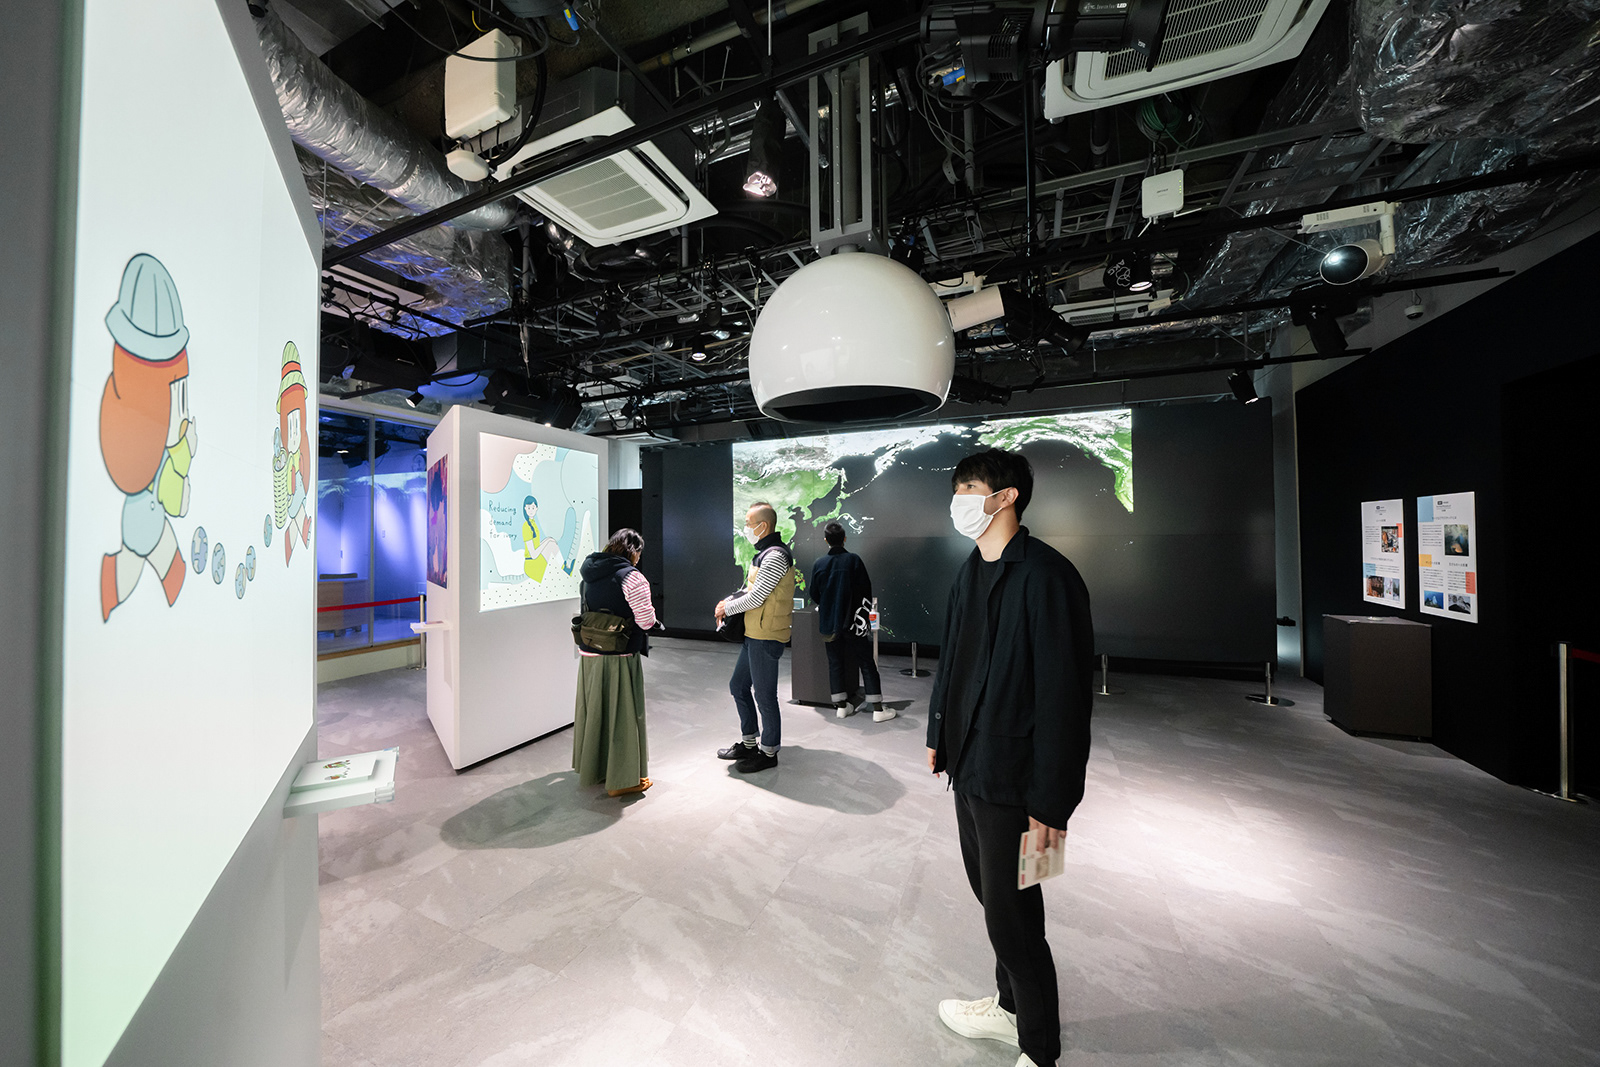
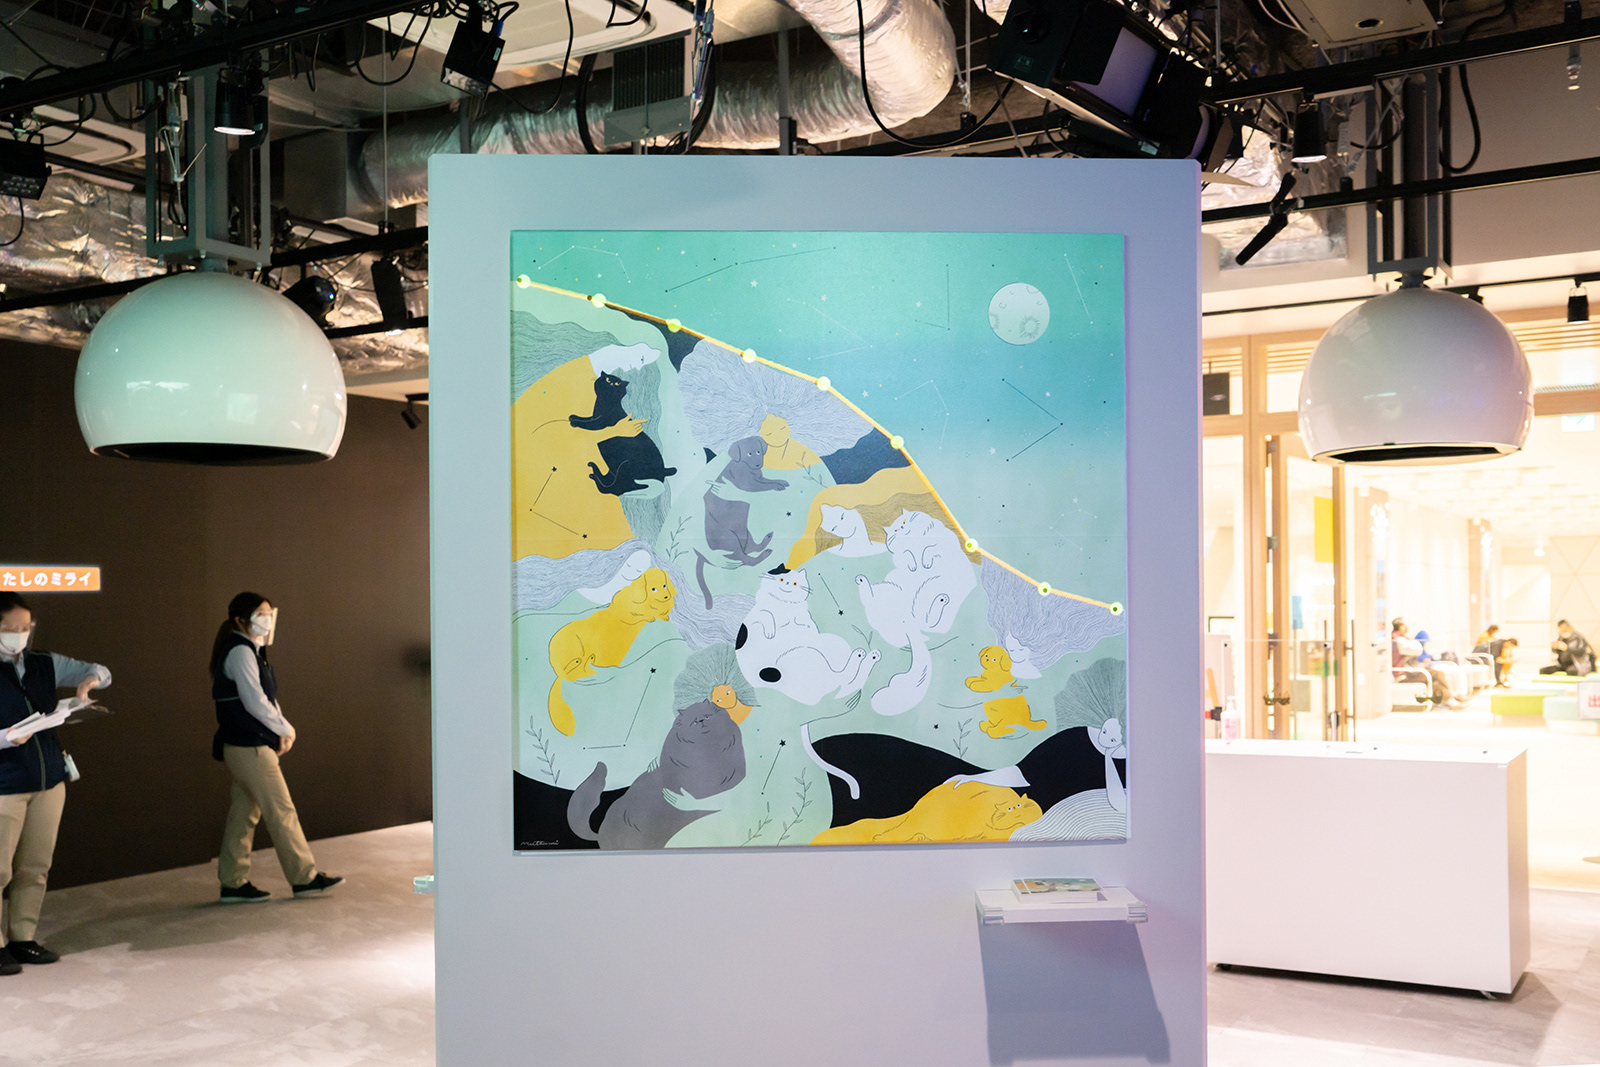
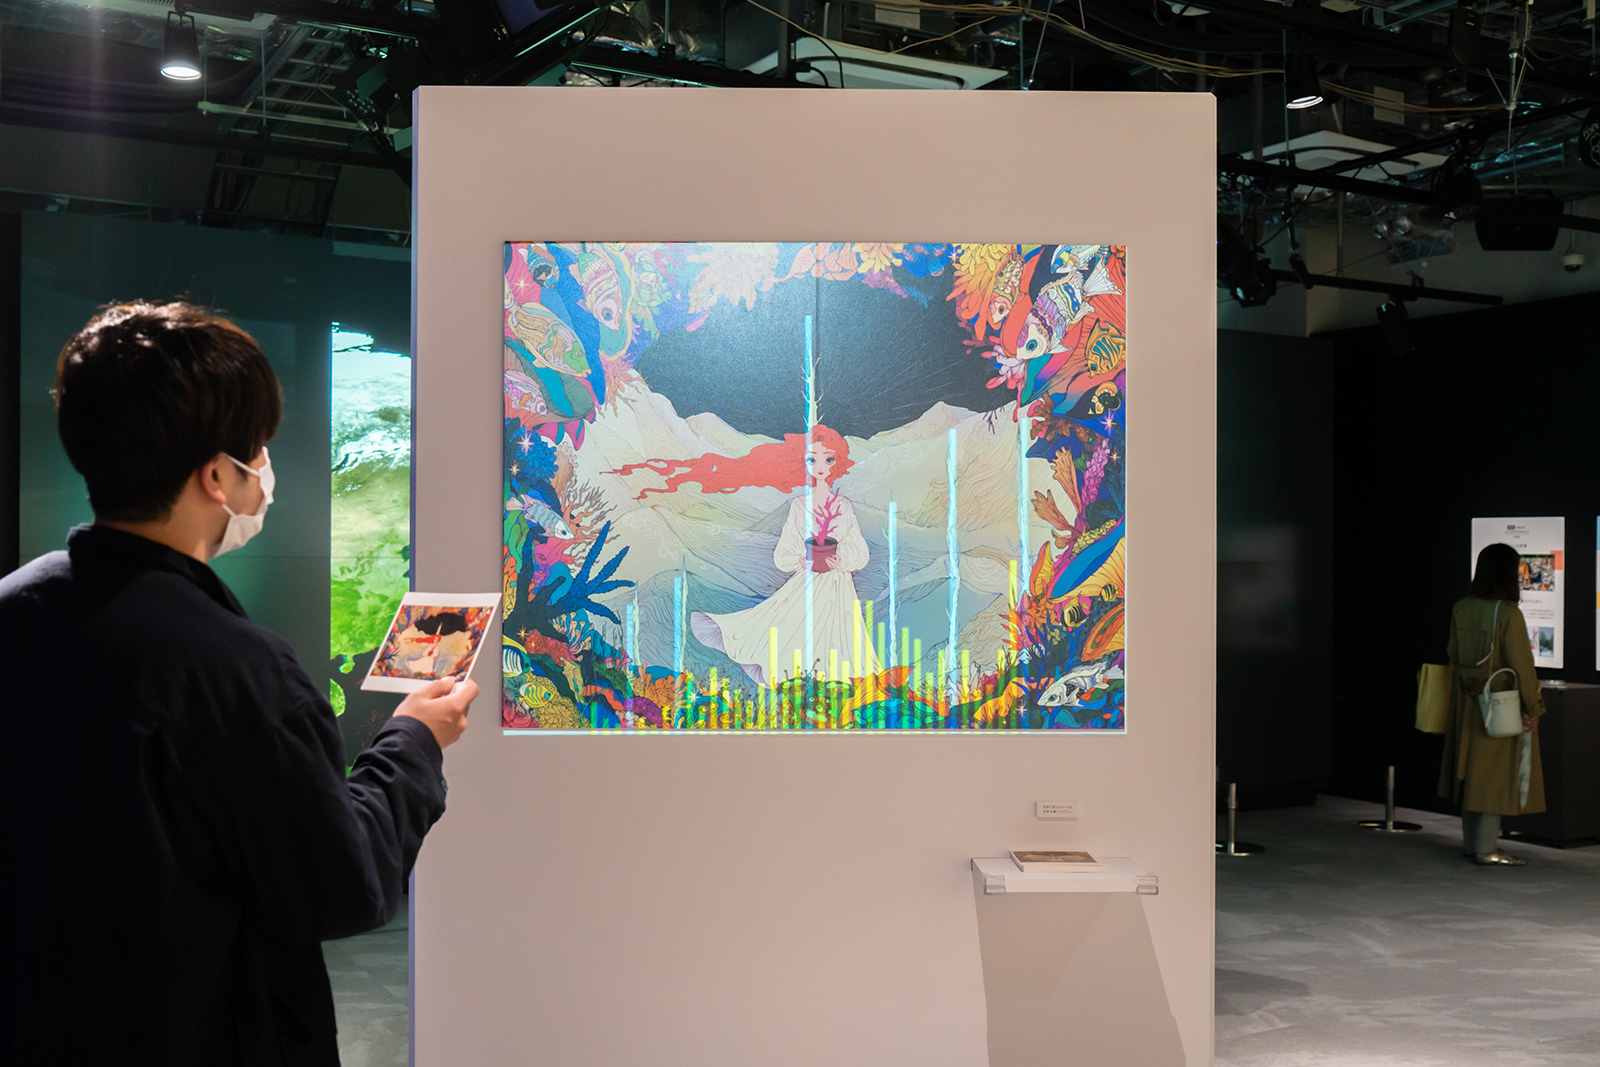
NHKプラスクロス渋谷における展示参加 参加アーティスト:Wisut Ponnimit / Nanaco Yashiro / Lito / Mutsumi Kawazoe
WORK SHOP
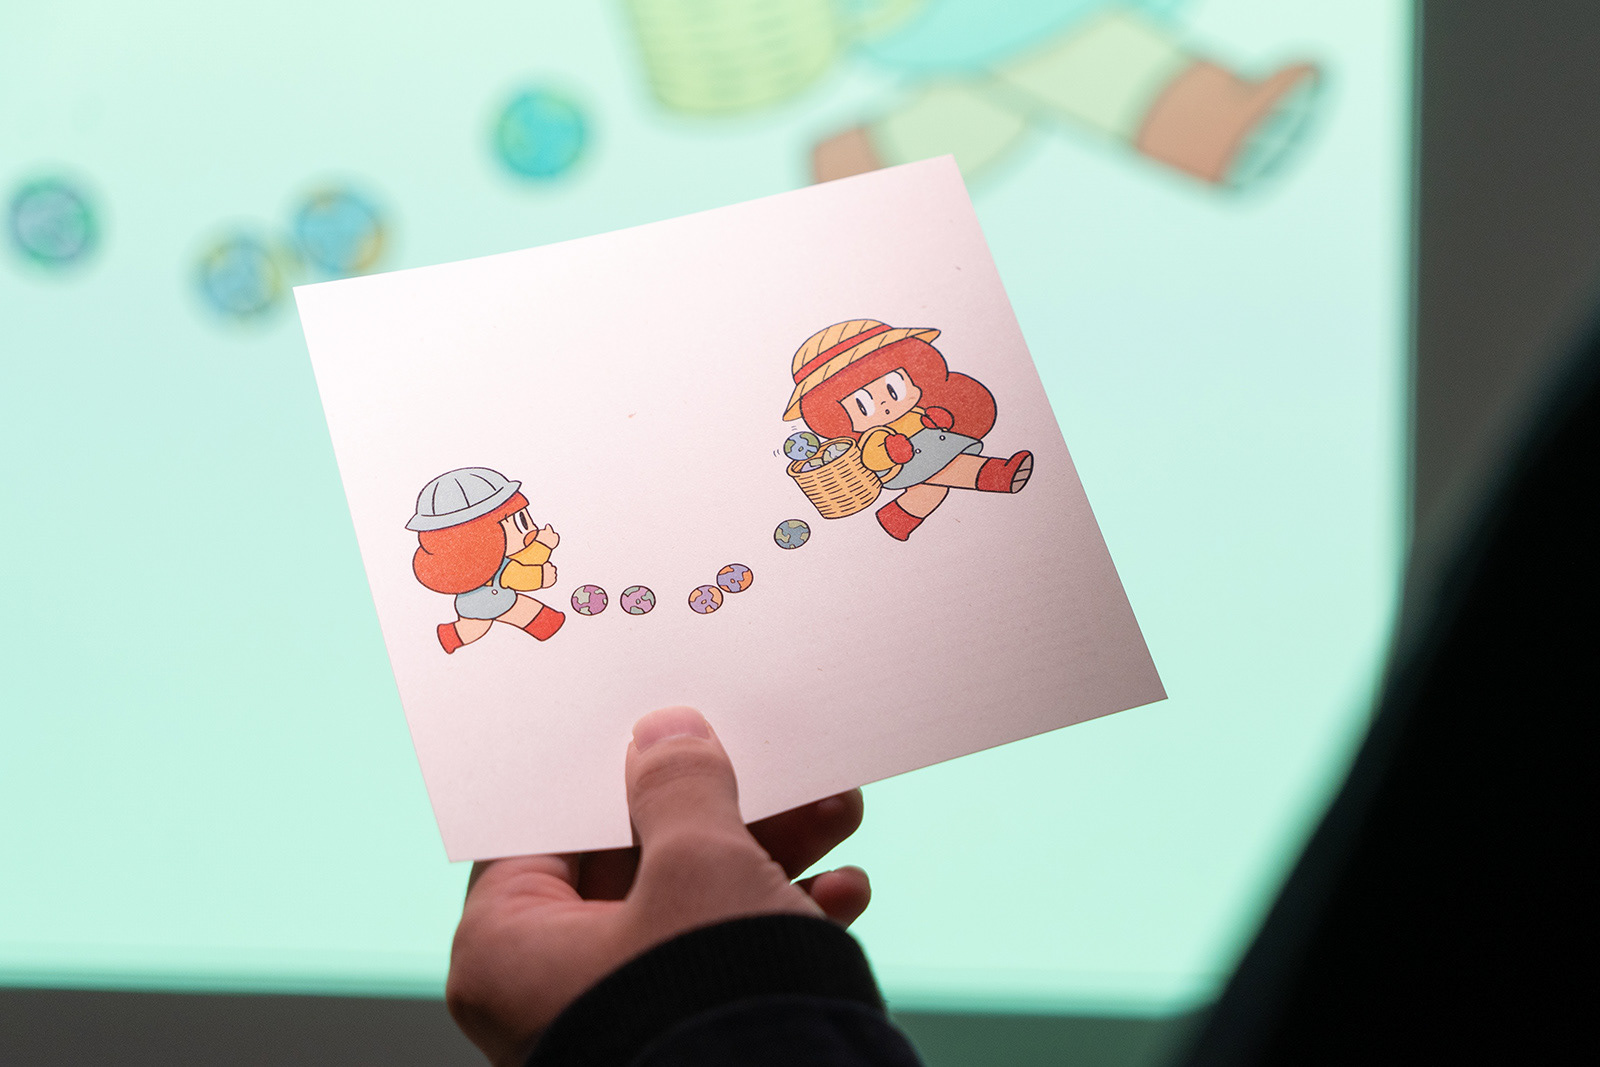
chart project®では、社会課題のグラフが描かれたシートに、自由に絵を書いてもらうワークショップを、イベントにあわせて開催しています。自治体や企業との共同開催によるワークショップを通して、たくさんの子どもたちに参加してもらい、社会課題のグラフに触れる機会を提供してきました。
The chart project® holds workshops in conjunction with events where participants are free to draw pictures on sheets with graphs of social issues. Through workshops held jointly with local governments and companies, we have provided opportunities for many children to participate and come into contact with graphs of social issues.


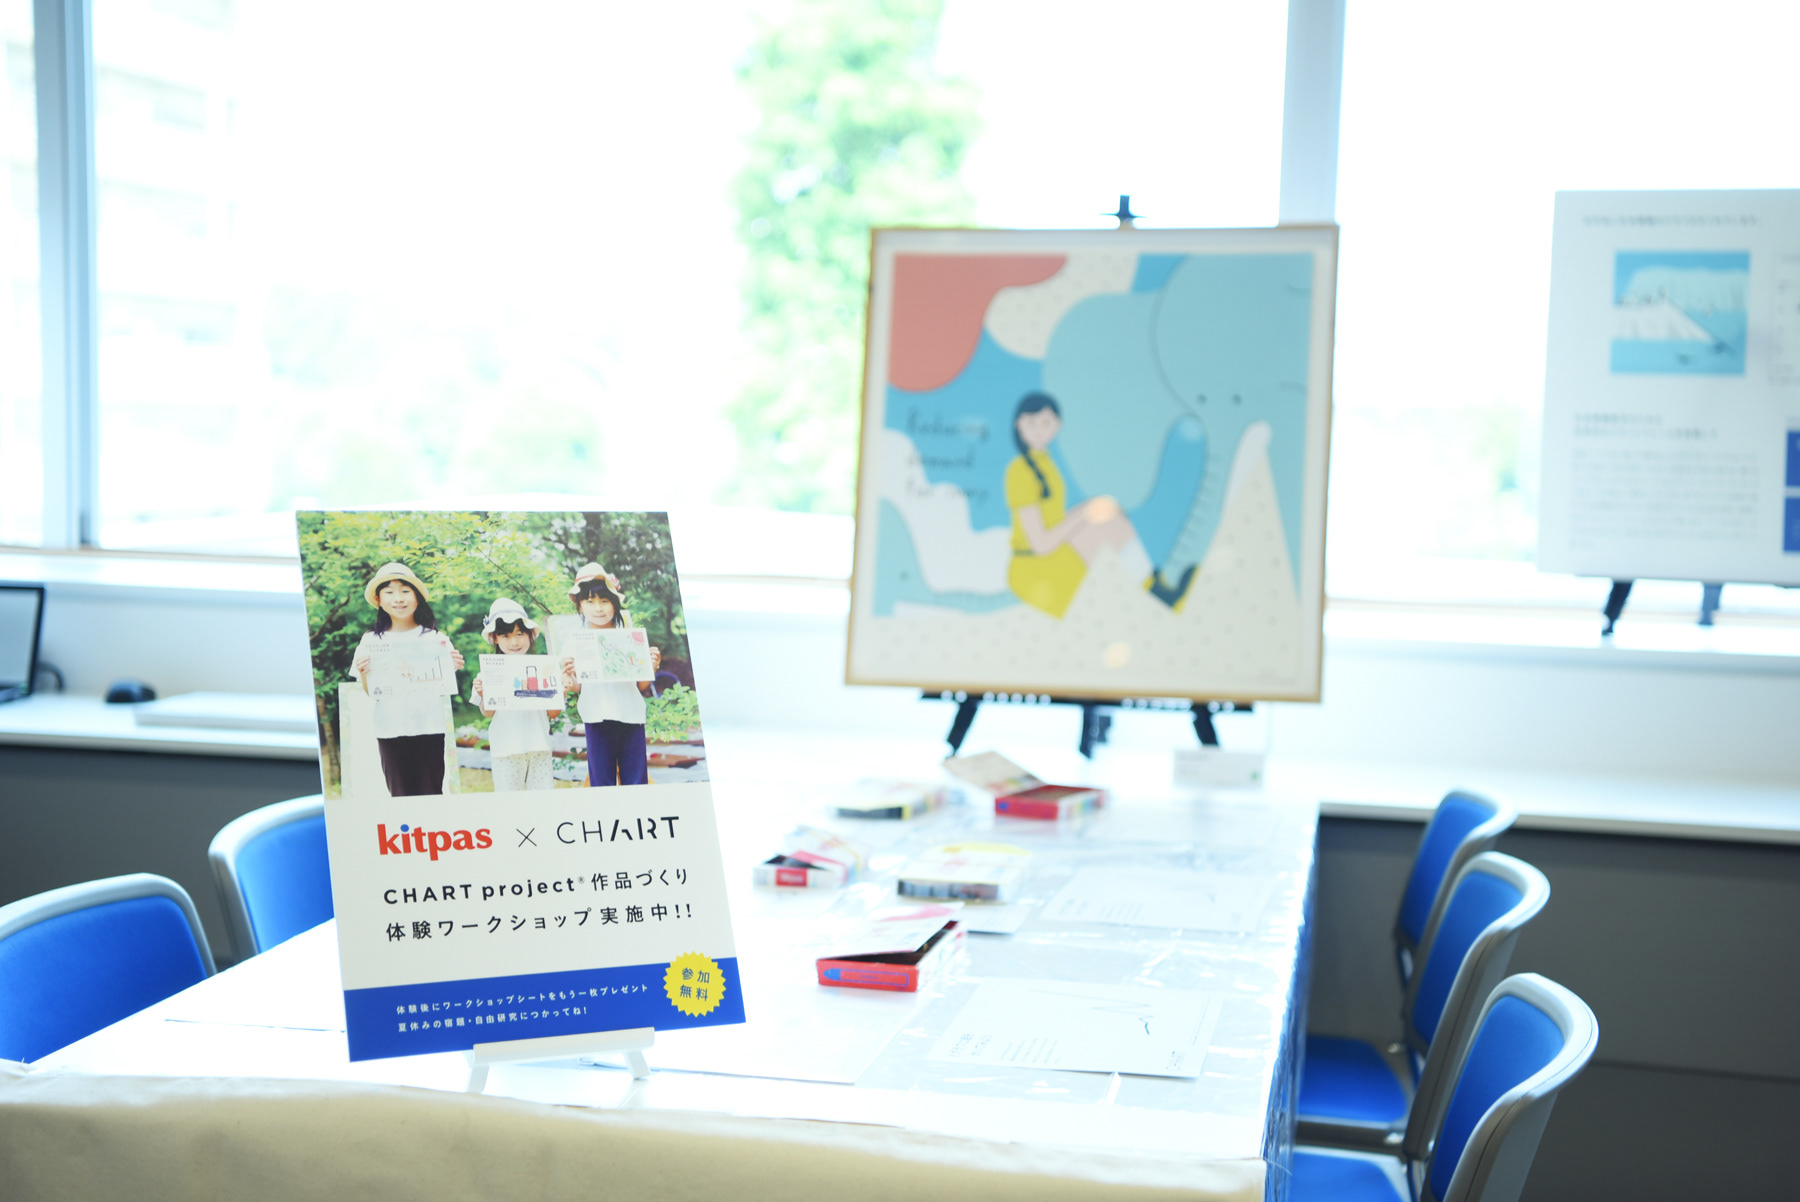
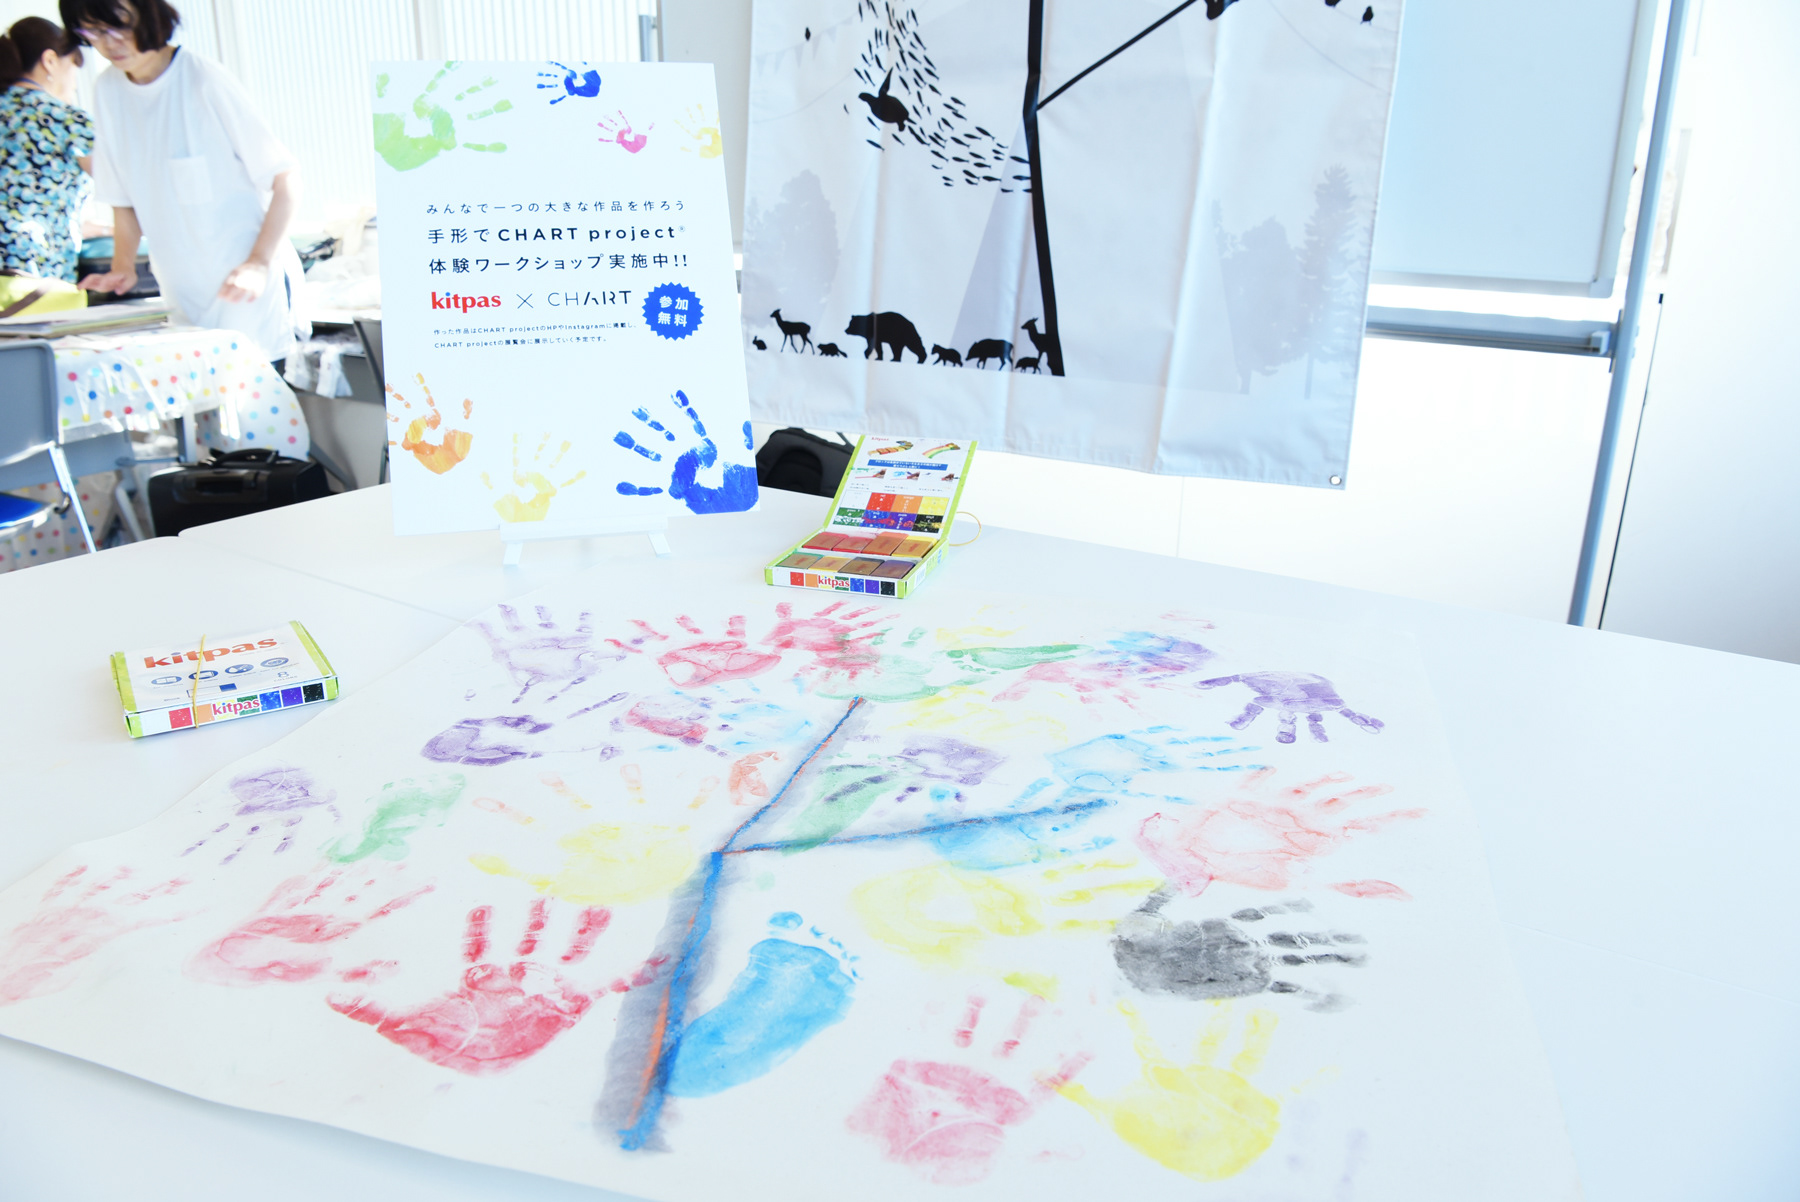

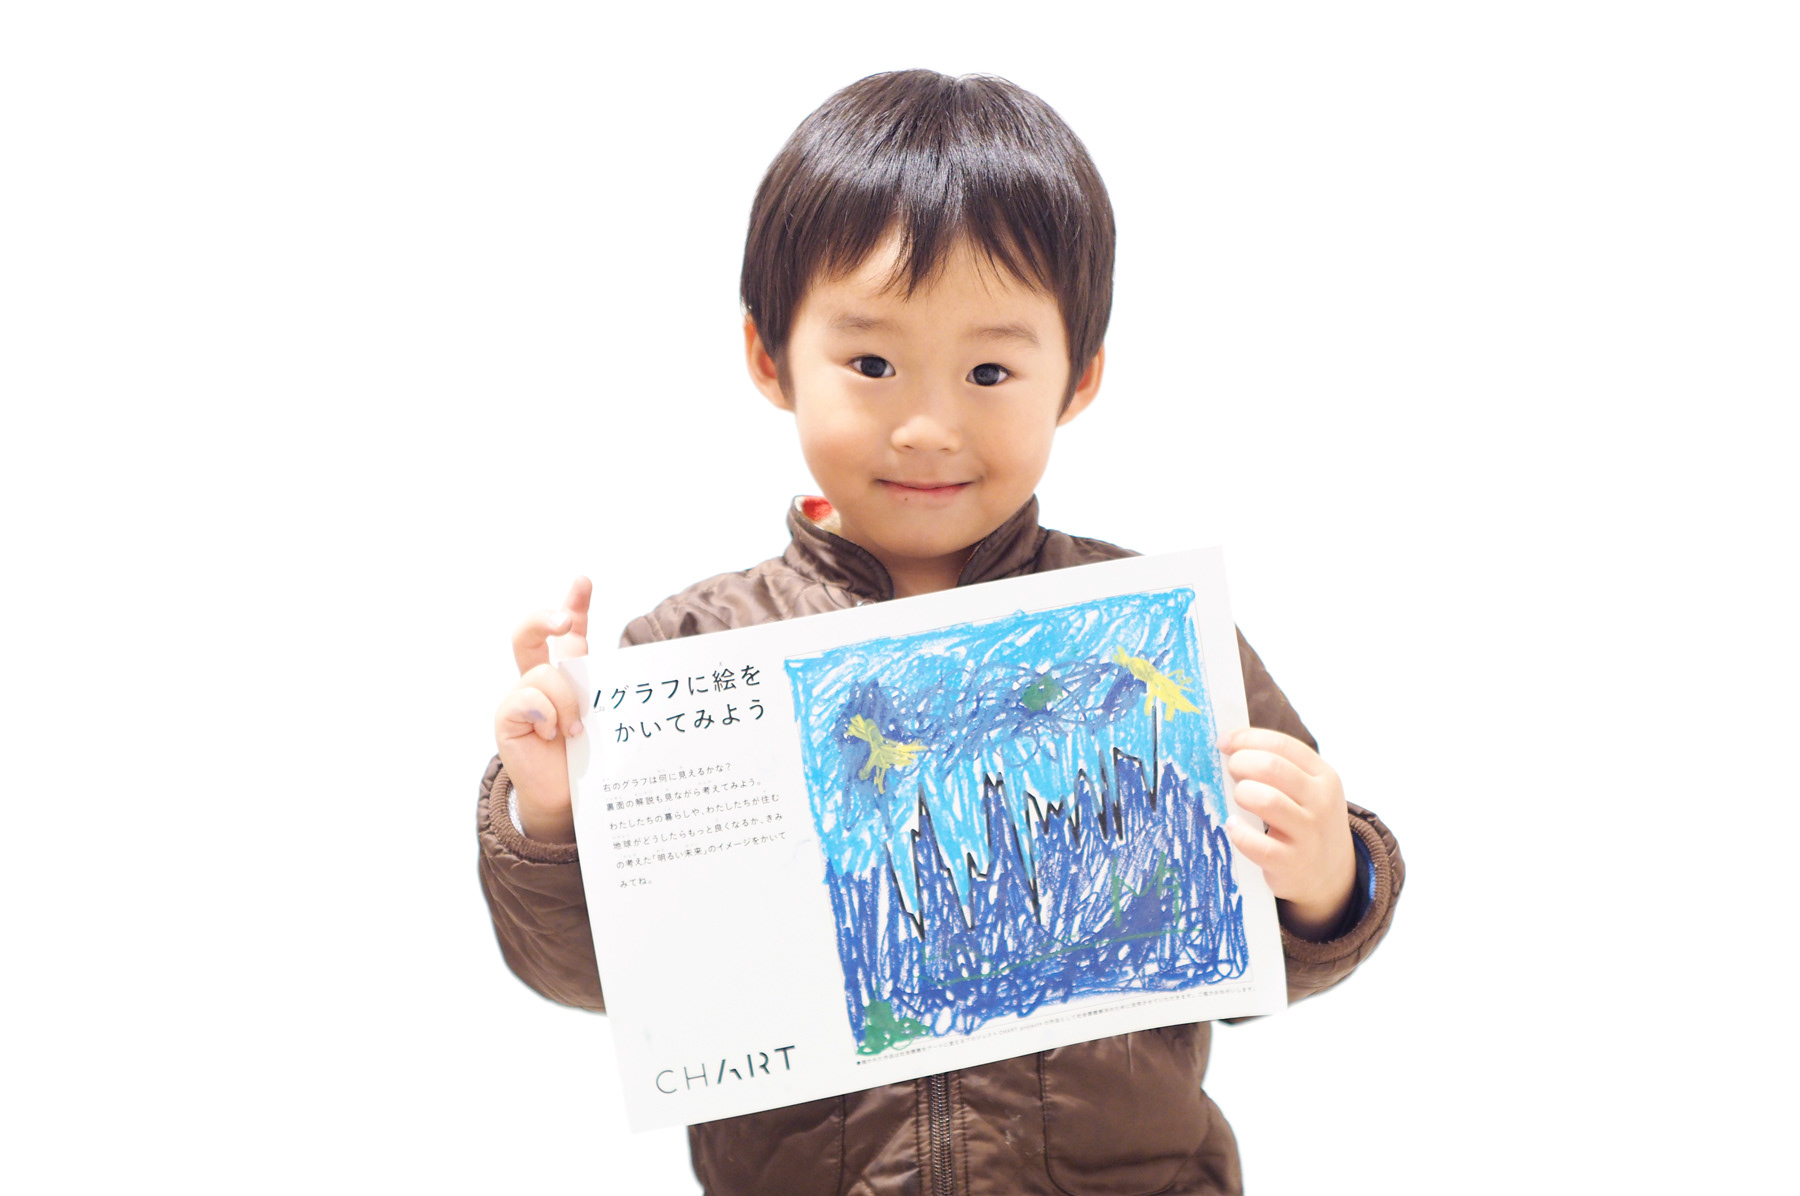
キットパス「夏休みワークショップまつり2019」 および 小松市サイエンス・フェスタ2019におけるワークショップの様子
Product
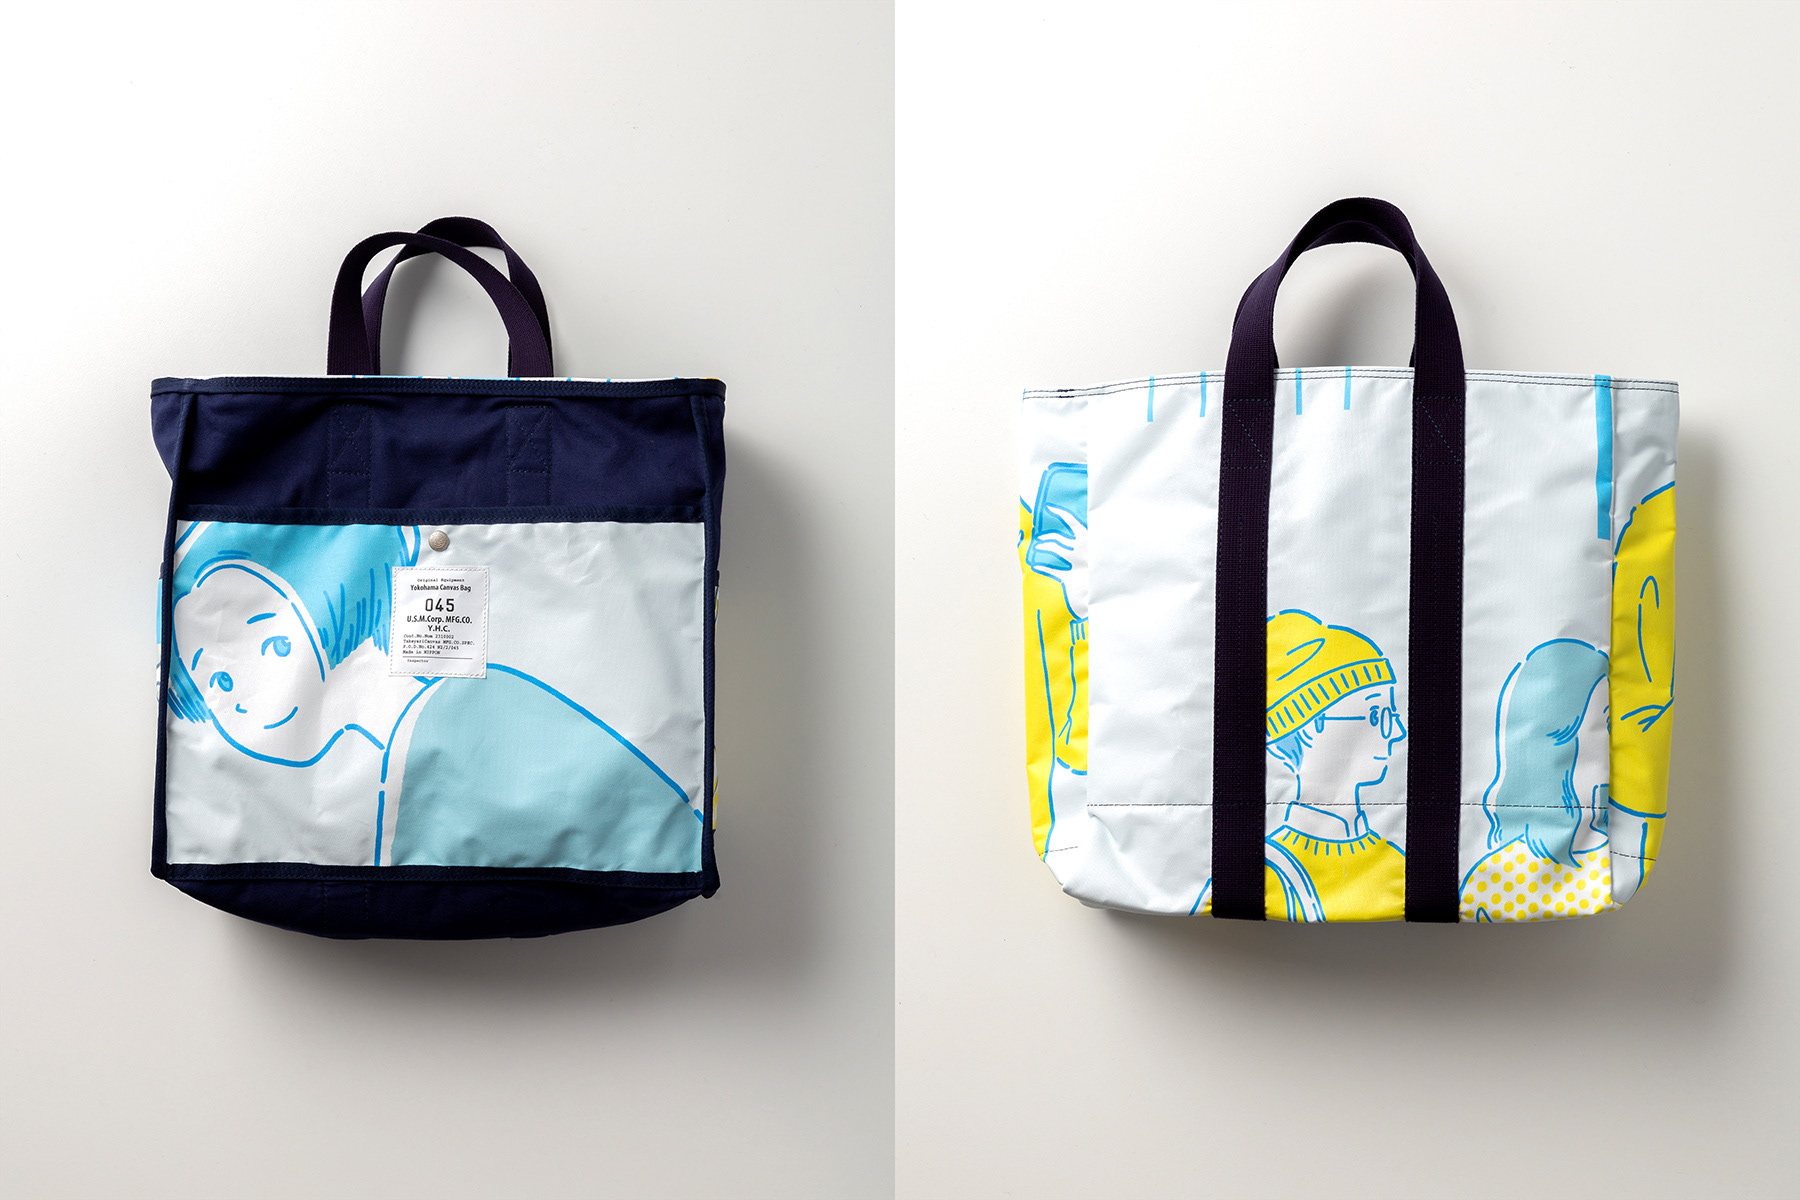
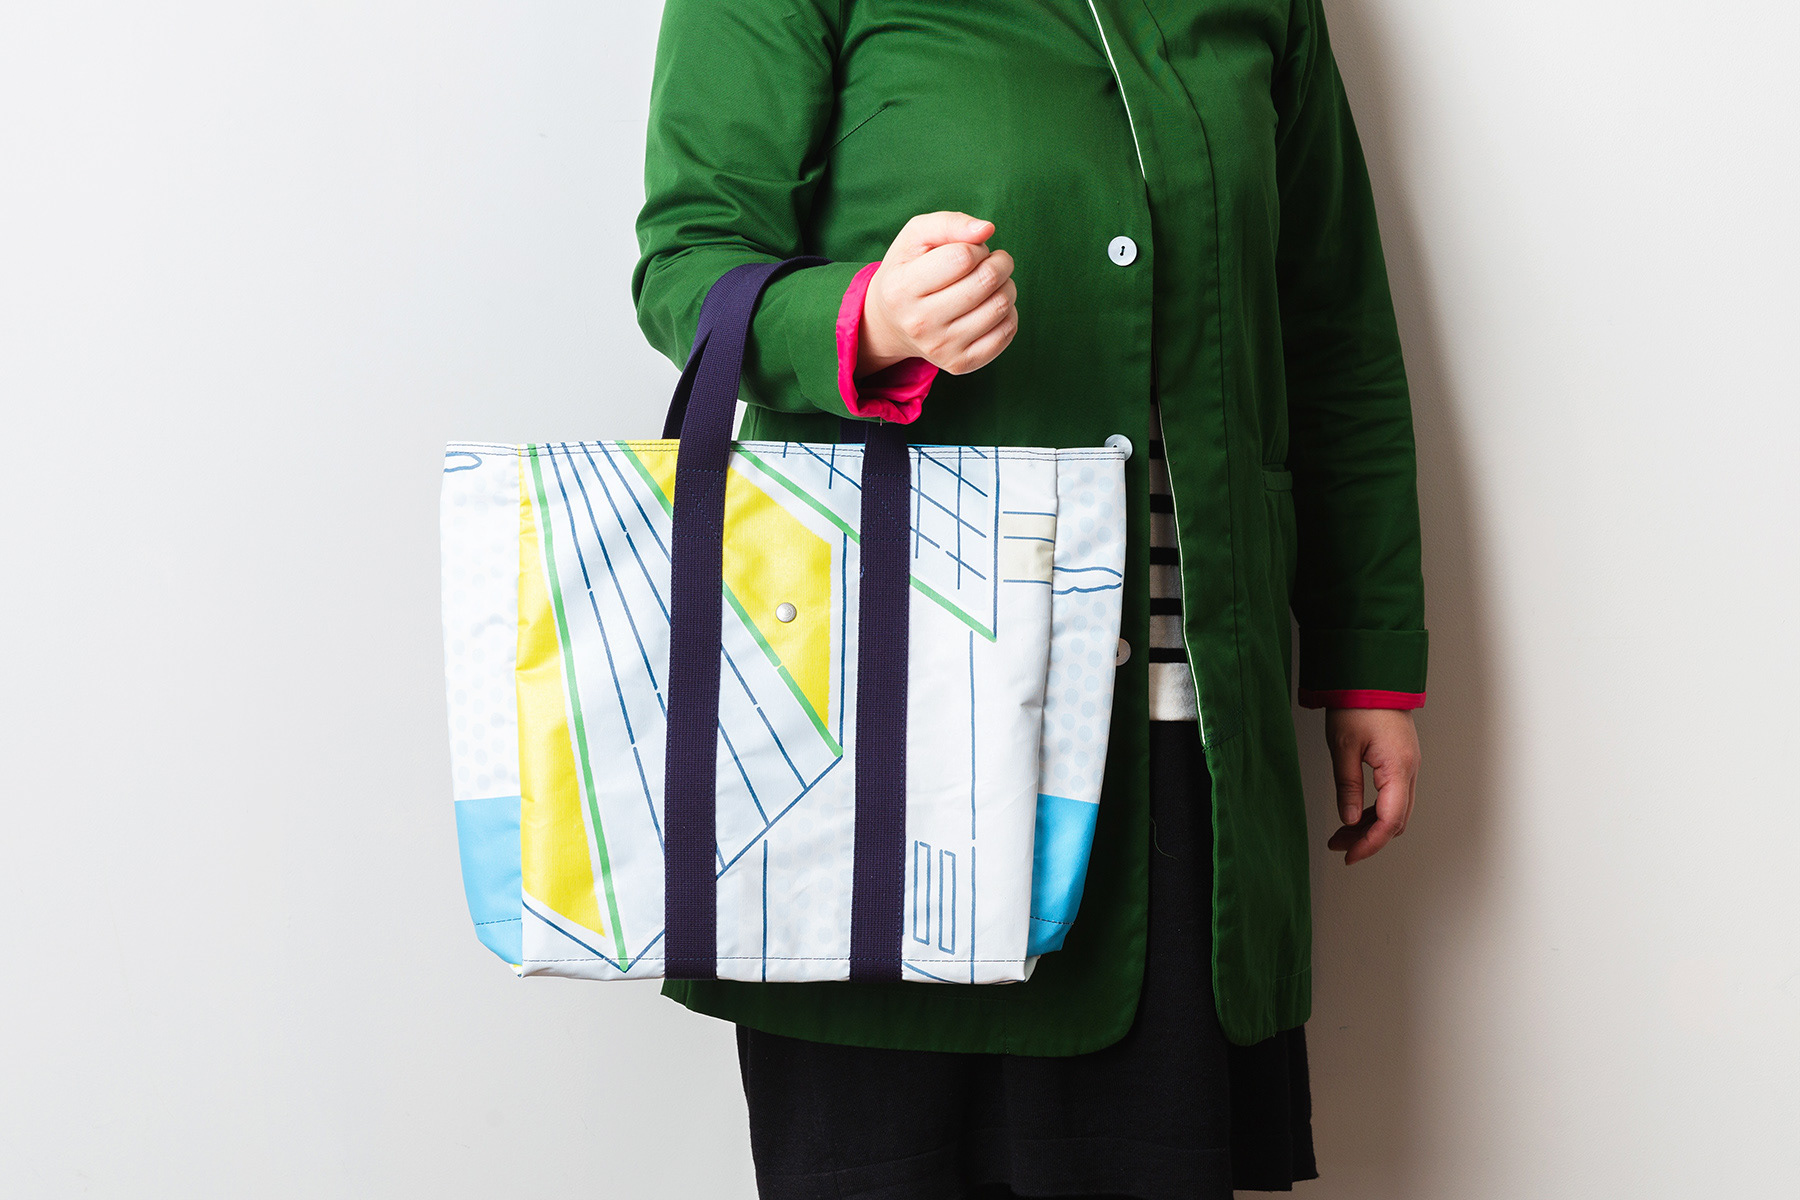
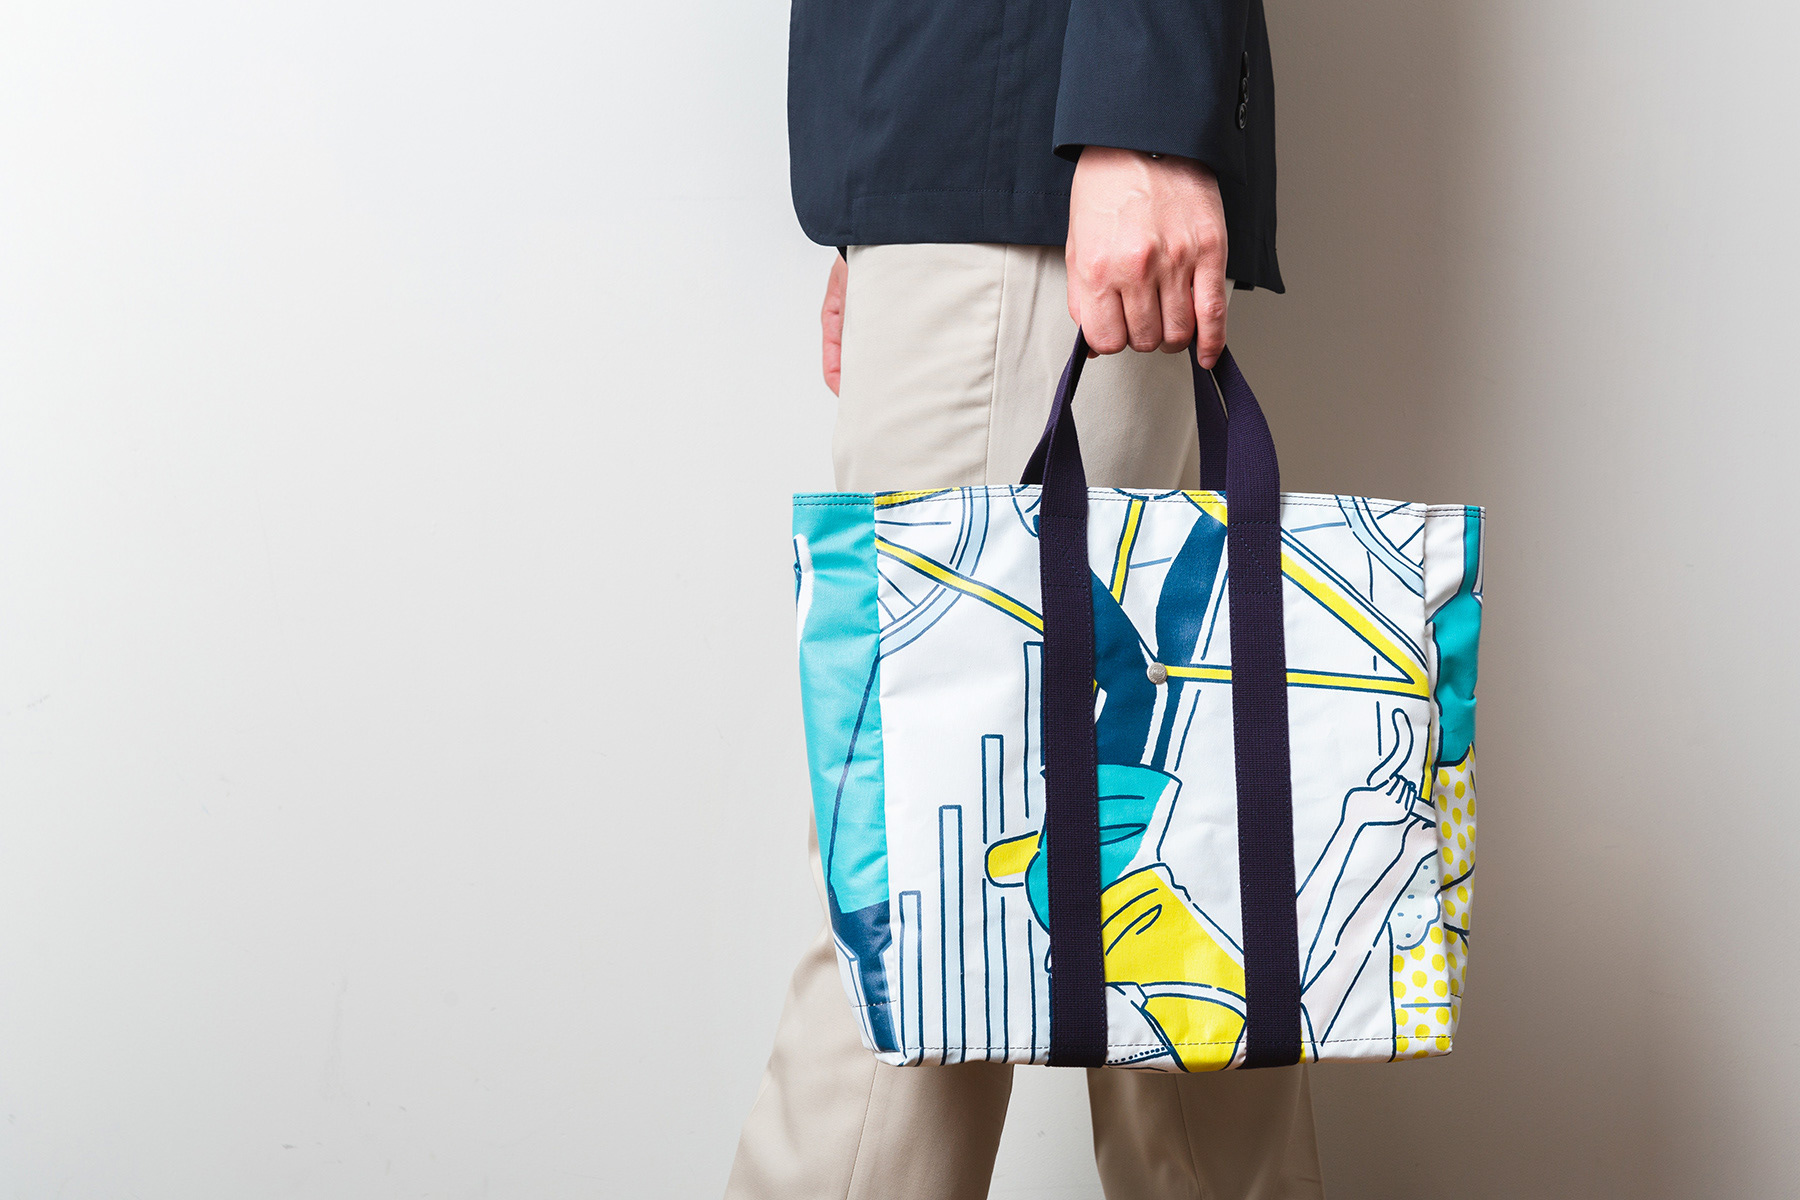
chart project®オリジナルグッズの制作も行なっています。2019年には渋谷の駅前にchart projectを使った巨大広告を掲出。そのまま廃棄されてしまう広告素材を、横濱頒布鞄とともにオリジナルバッグへとアップサイクルしました。
We also produce original goods for chart project®. in 2019, we put up a huge advertisement using chart project® in front of the scramble crossing in Shibuya. We upcycled the advertising material, which would have otherwise been discarded, into original bags together with Yokohama Canvas Bag.
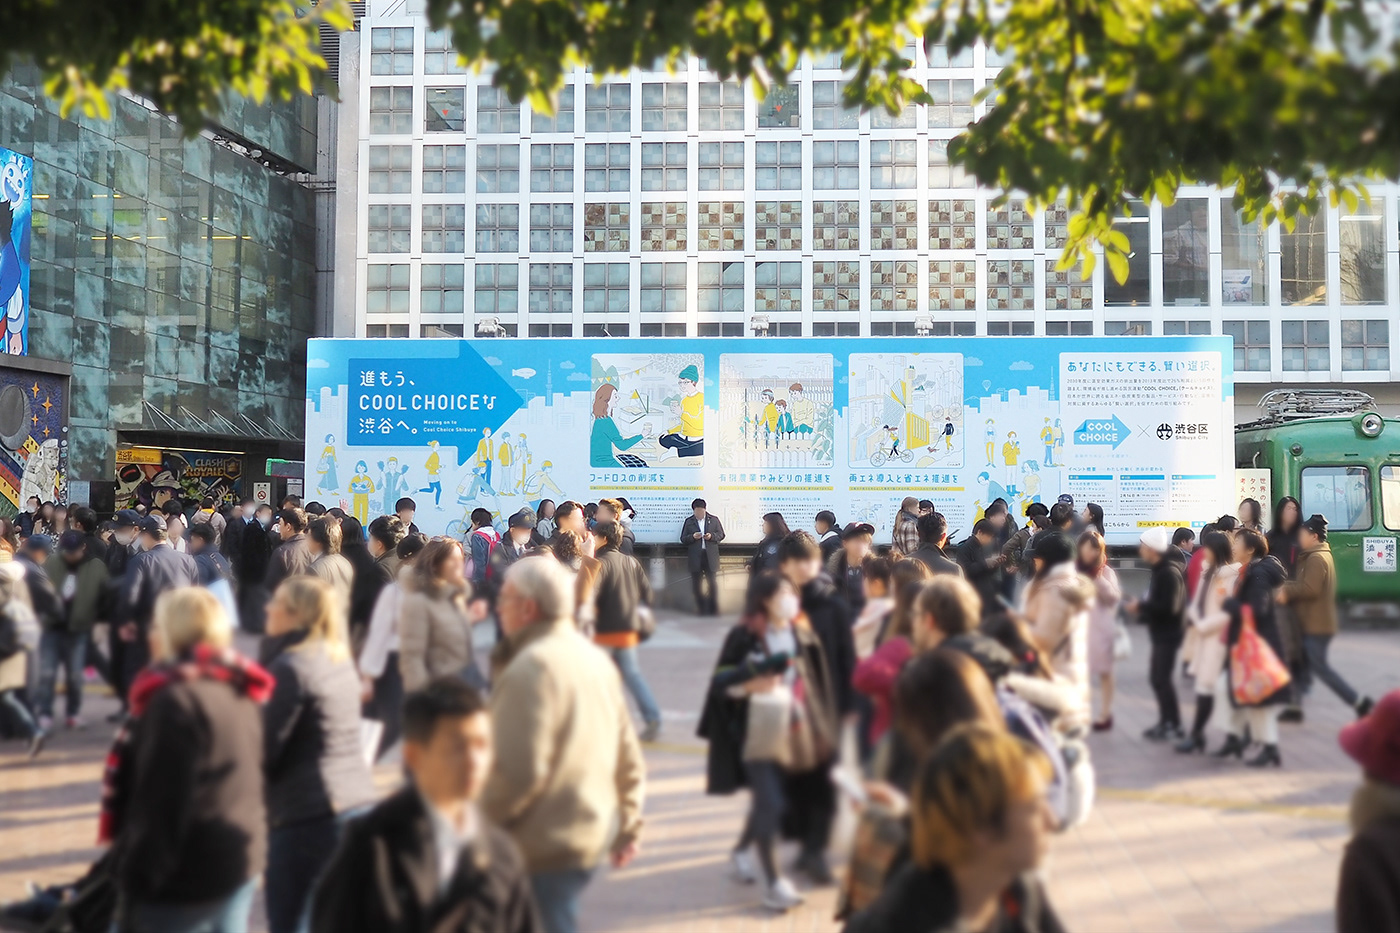

渋谷区による環境省「COOL CHOICE」の啓発広告 Illustration : Mutsumi Kawazoe Photography : CCDN
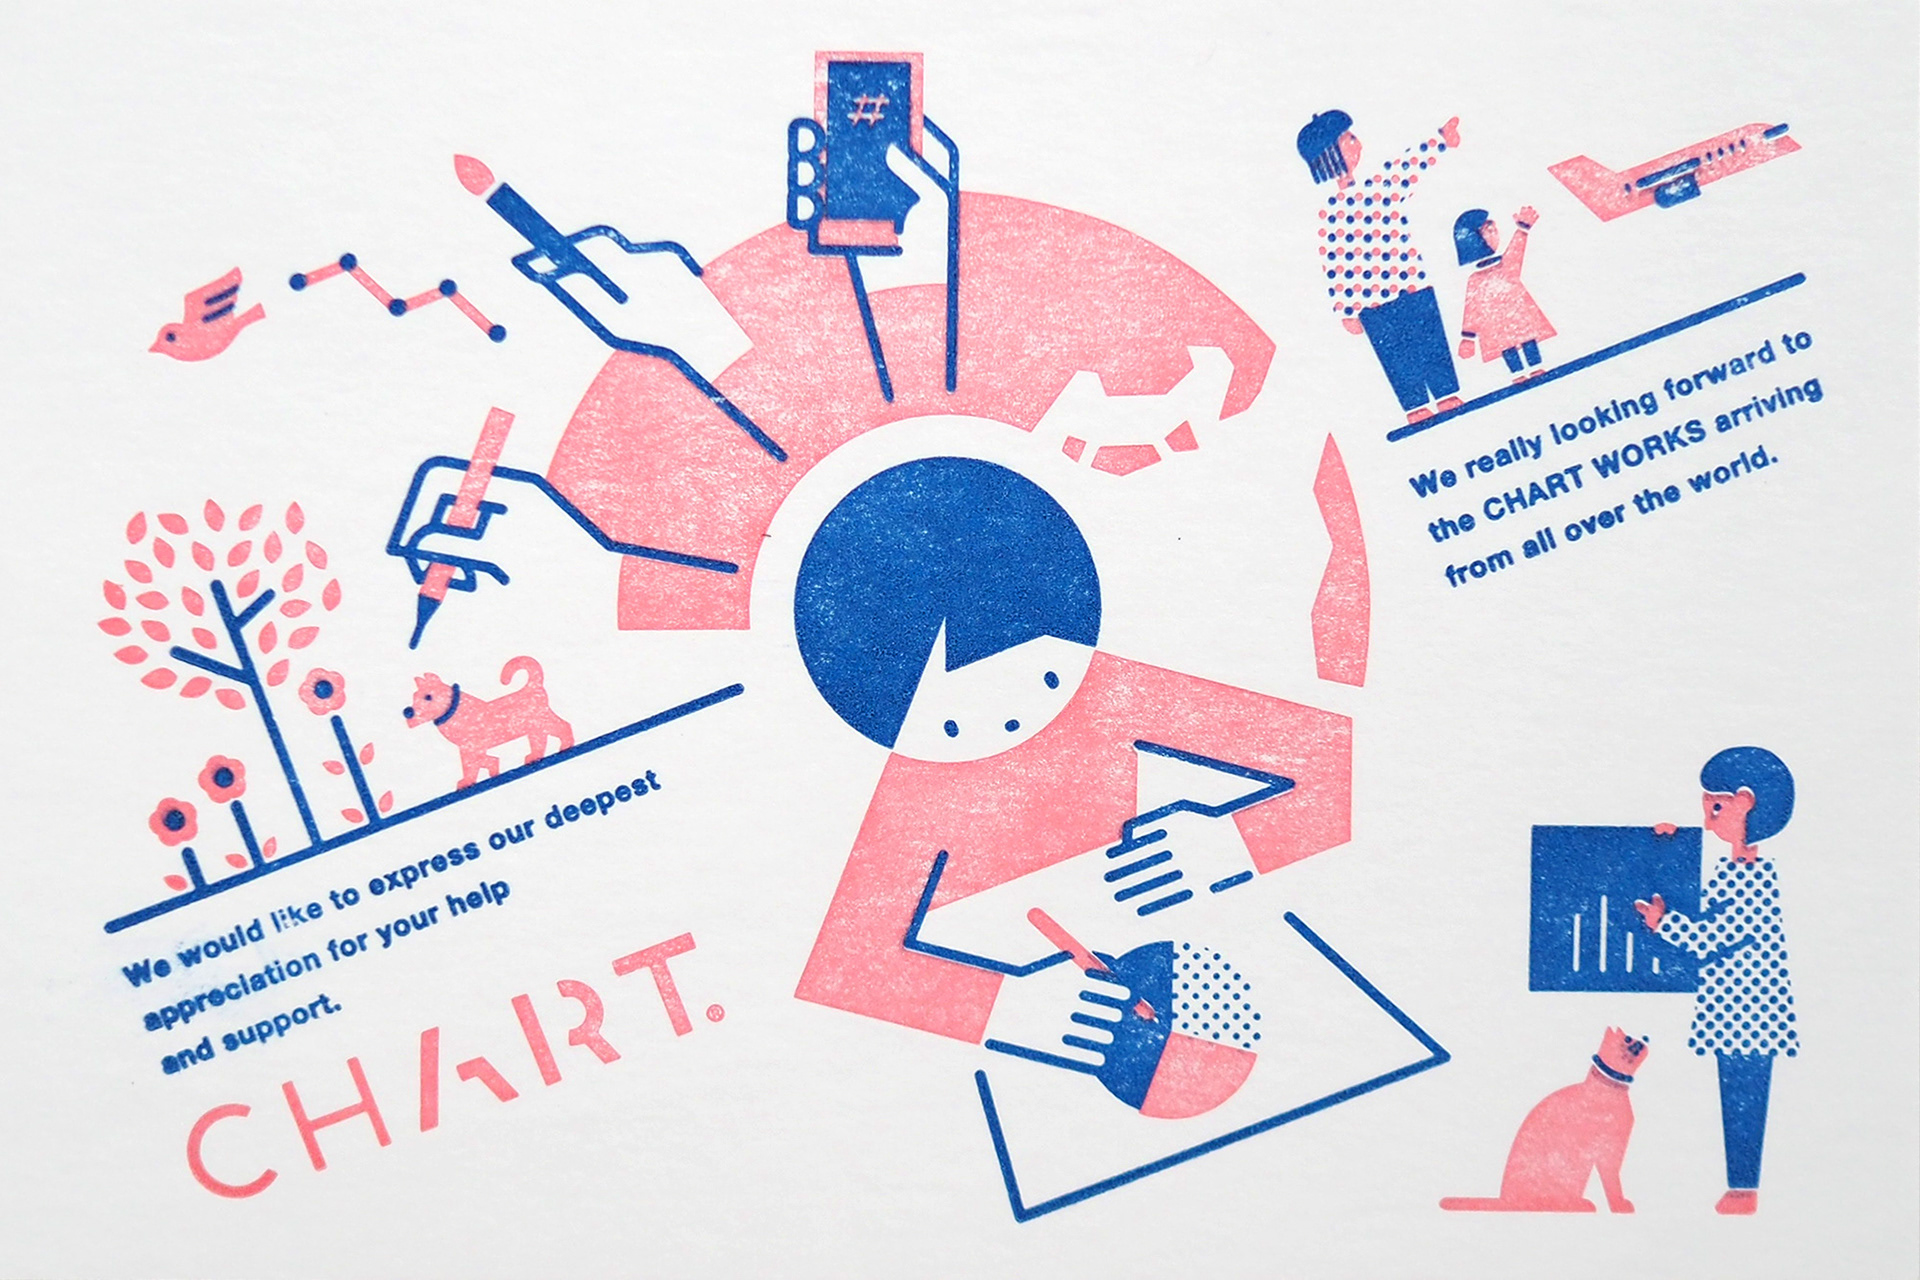
2017年のクラウドファンディングで制作した活版印刷によるオリジナルポストカード/Illustration : Masaomi Fujita / tegusu Inc.
TV commercial
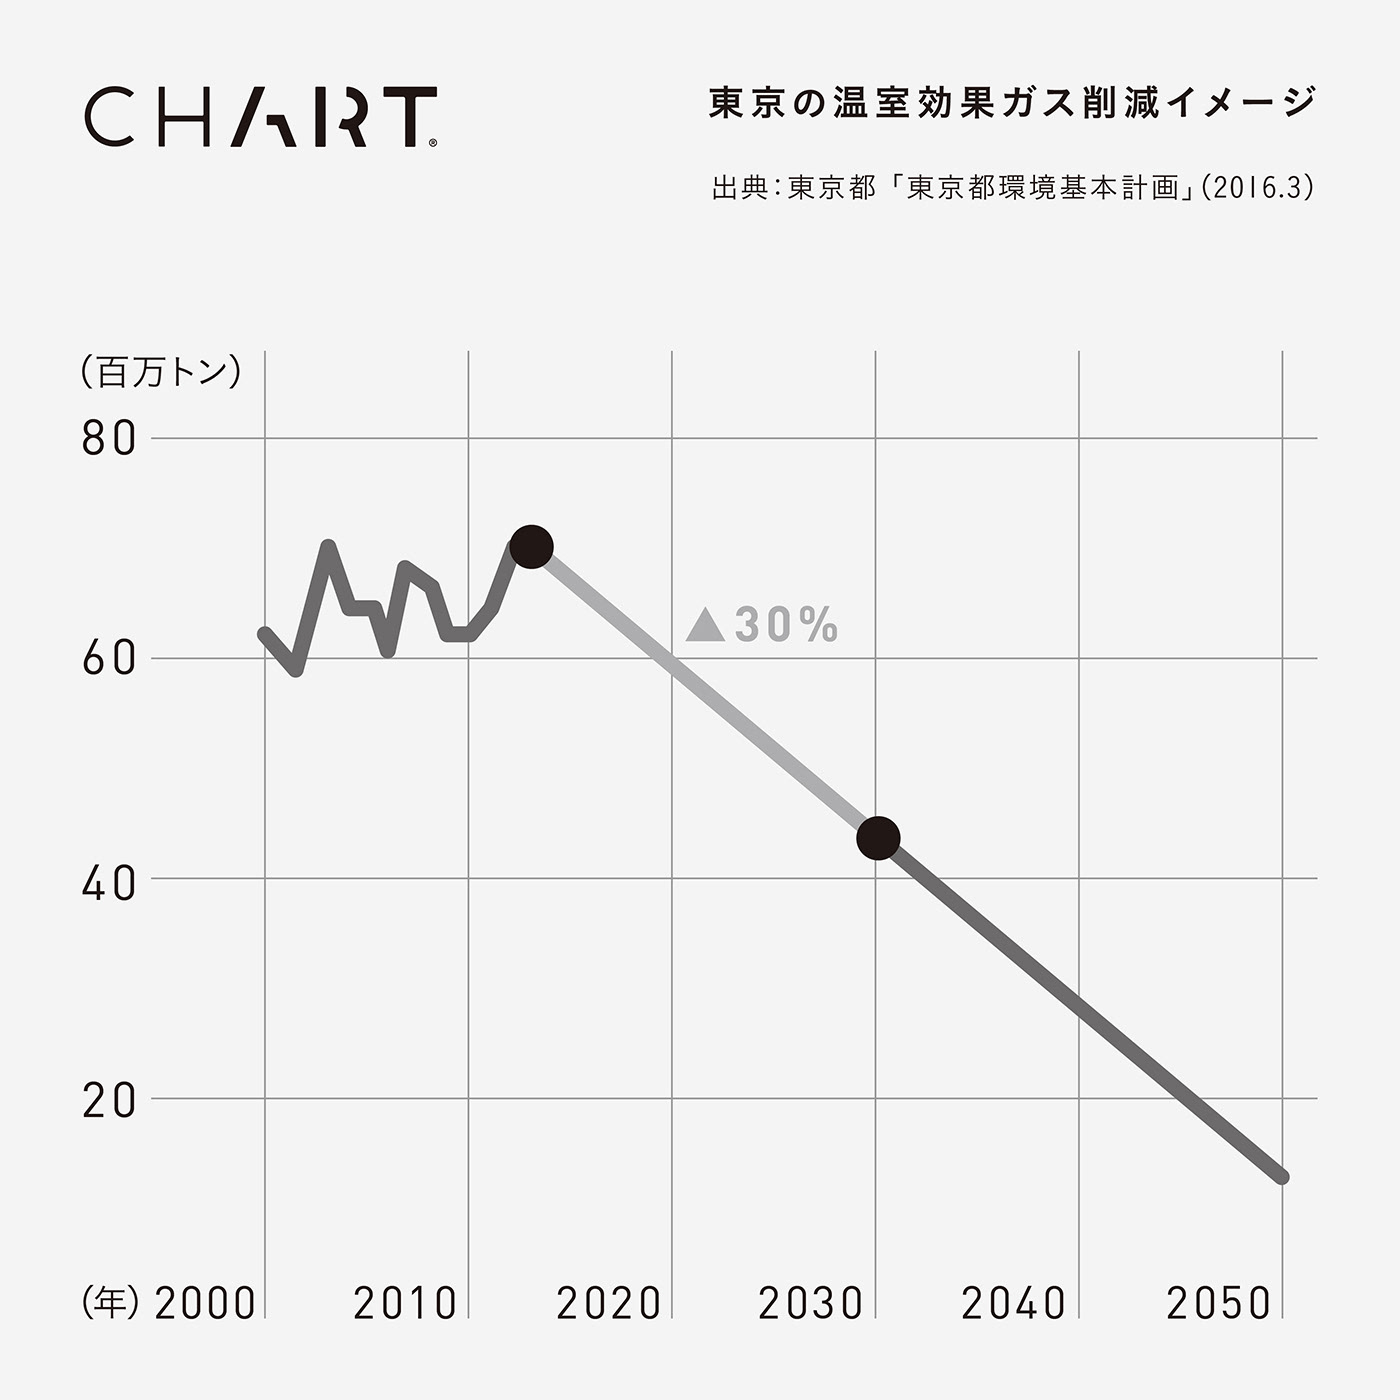
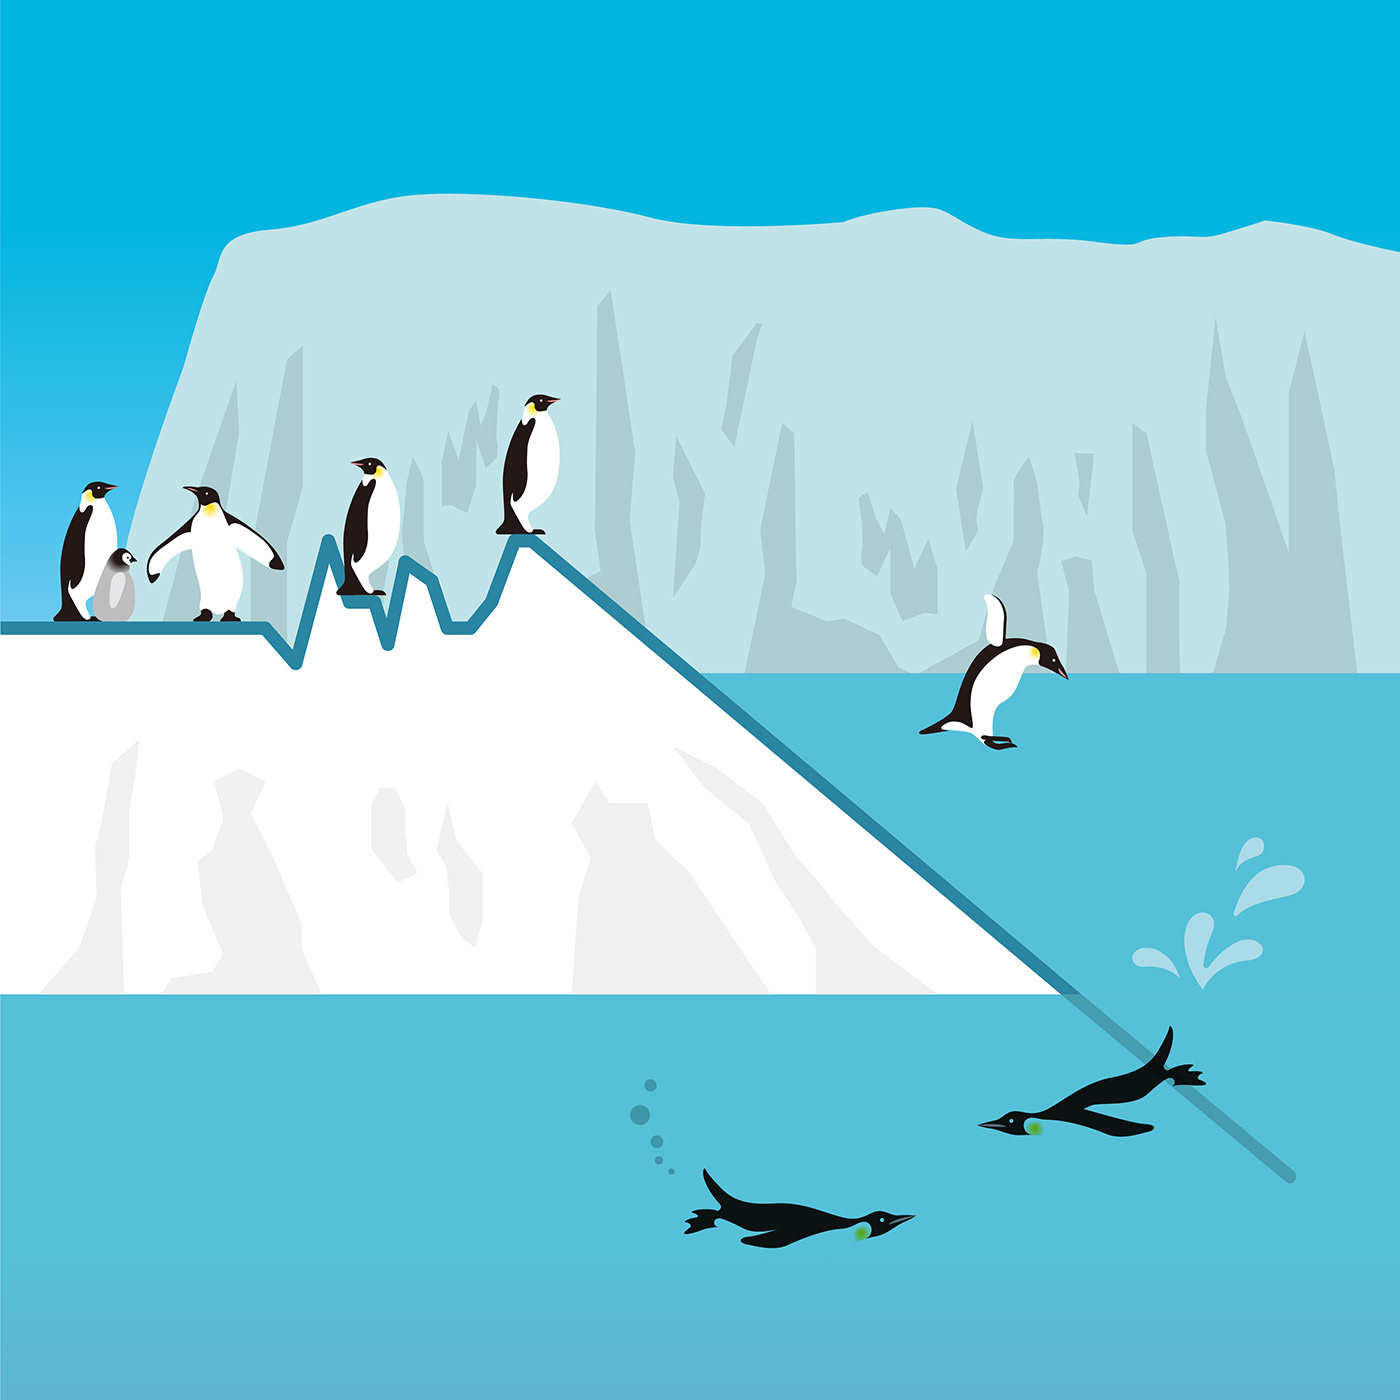
chart project®ではTV用のCMも制作しています。石川県内で行ったプロジェクトに伴い、chart projectを紹介するCMが放映されました。東京都地球温暖化防止活動推進センターと、環境保全団体WWFジャパンから提供頂いたグラフをもとに、東京の温室効果ガス削減イメージのグラフをもとにした「ペンギン篇」、国民一人当たりの二酸化炭素排出量のグラフを表す「パンダ篇」、世界の二酸化炭素排出量のグラフを表す「トナカイ篇」の3つの動画を制作しました。
chart project® also produces commercials for TV. The commercial introducing the chart project was aired during a project in Ishikawa Prefecture. The Tokyo Metropolitan Center for Climate Change Actions and WWF Japan provided us with graphs to create three commercials below.
"Penguin" based on the graph of Tokyo's greenhouse gas reduction image, "Panda" showing the graph of carbon dioxide emissions per capita, and "Reindeer" showing the graph of global carbon dioxide emissions.
Art Direction, Illustration : tegusu Inc. / Film Direction, Animation : Tatsuki Kondo / Music : PUTBALSOUND
Local Project for SDGs
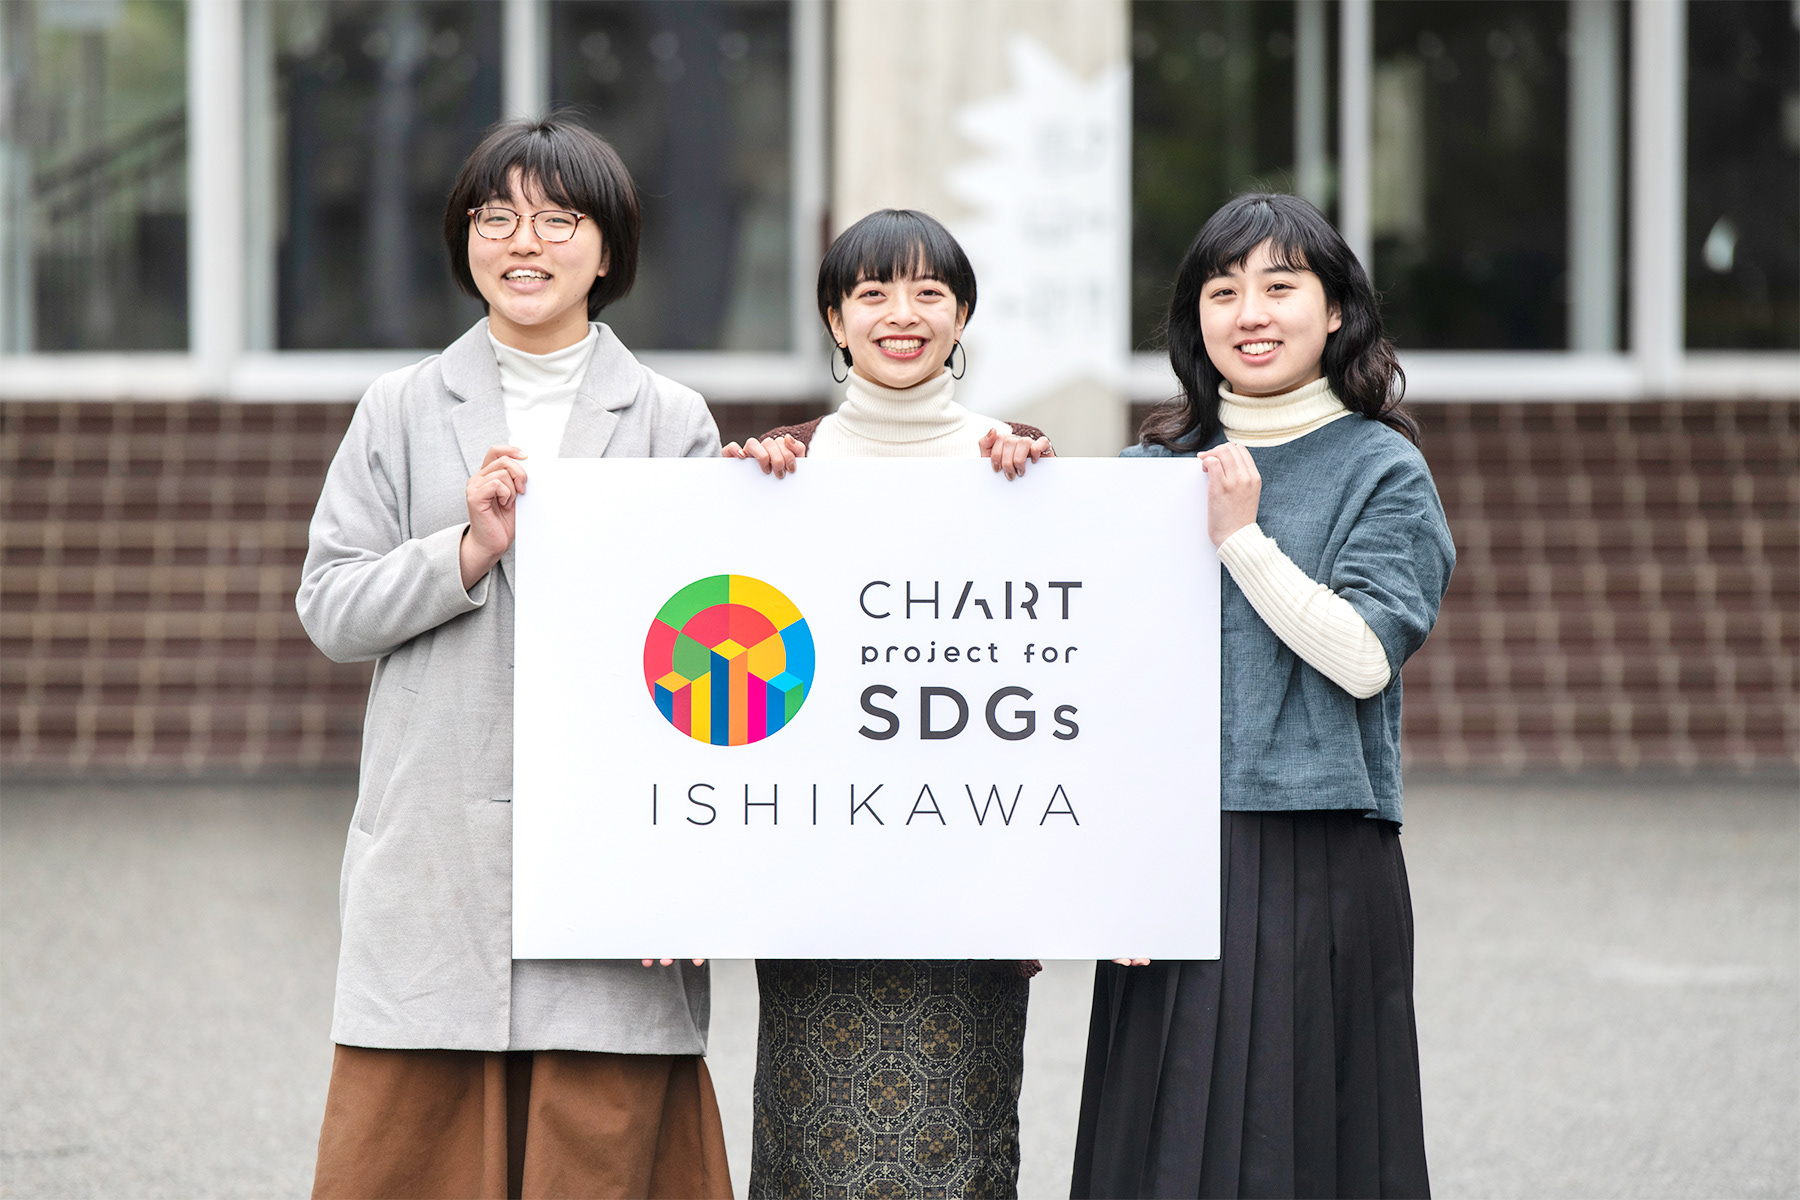
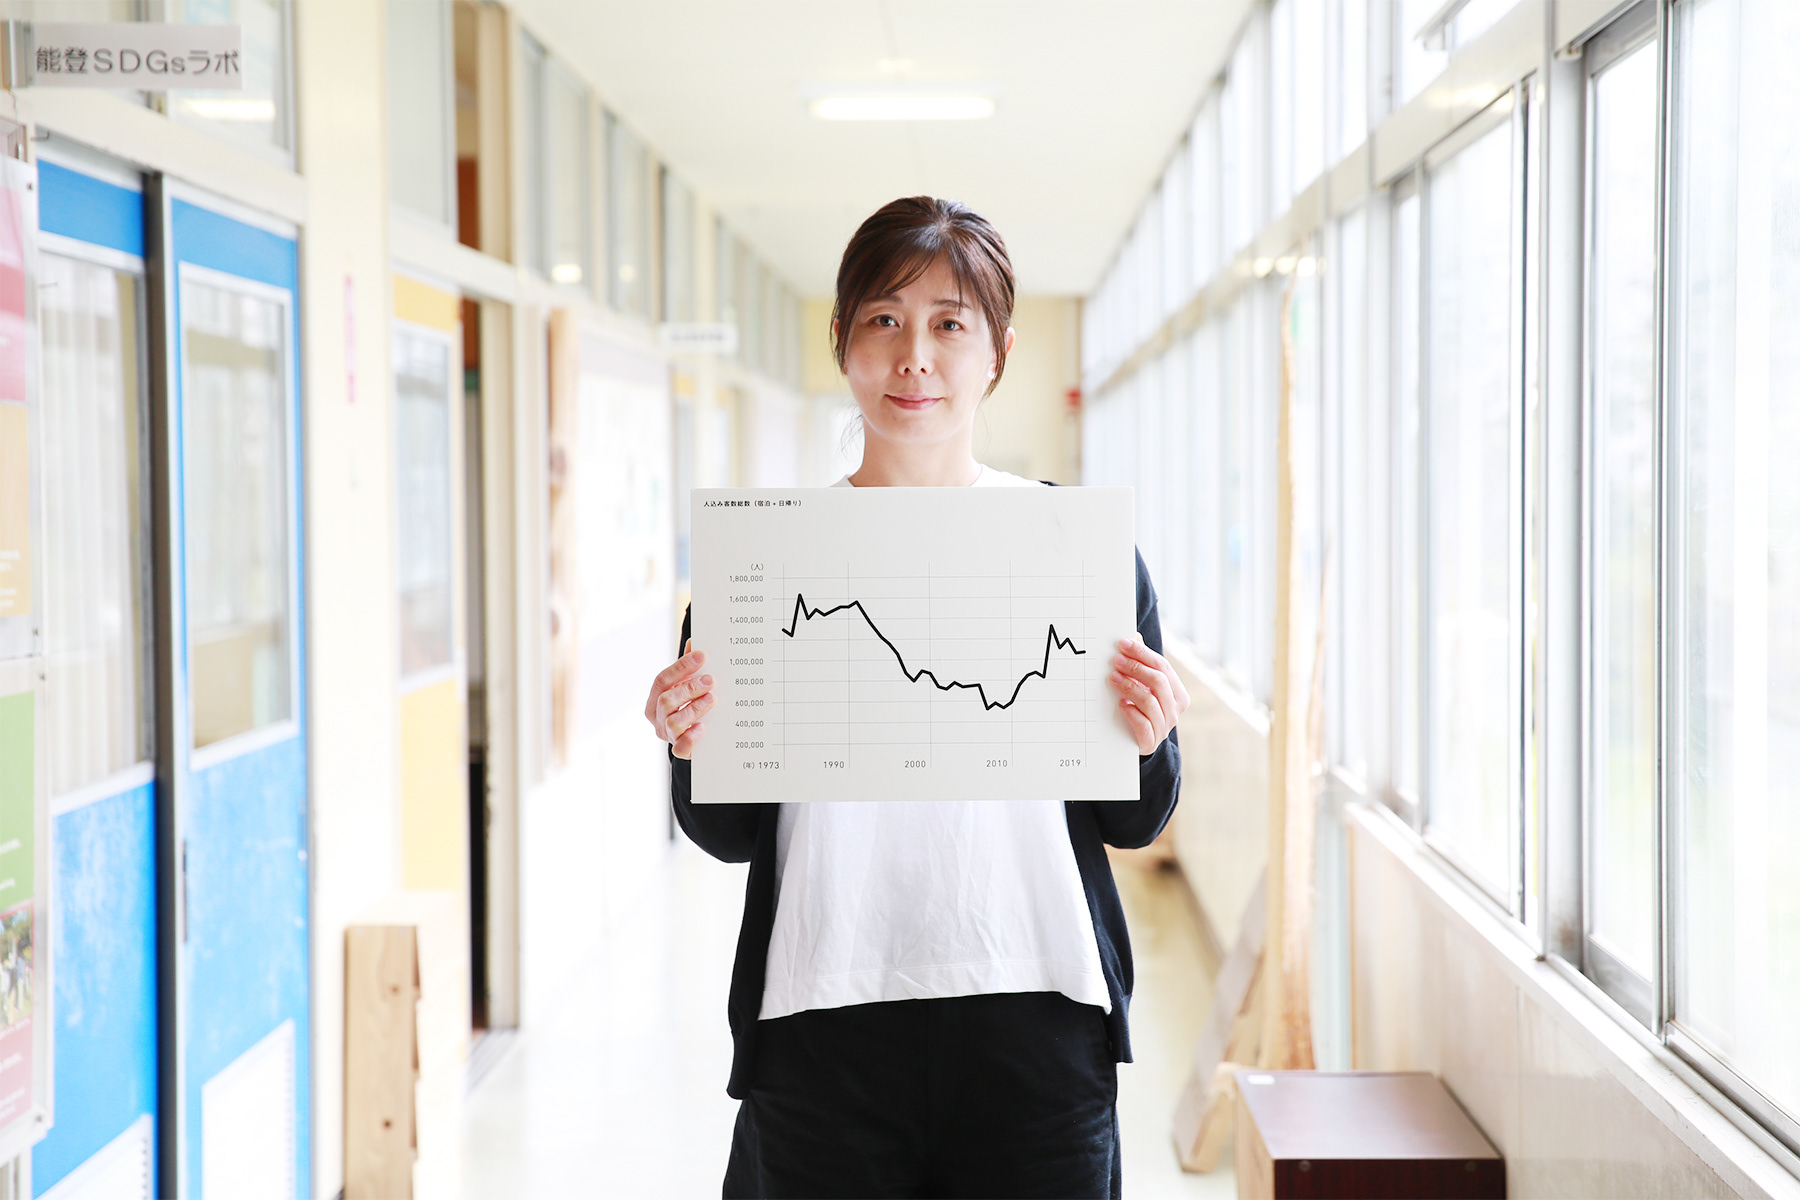
石川県においては、「chart project for SDGs in ISHIKAWA」をテレビ金沢、NIPPON AGENCYとともに共同主催しました。小松市では、最高気温の推移を表すグラフをモチーフに、立体作品「SAND GRAPH」を藤井 賢二さんとともに制作。また珠洲市においては、観光・社会・自然保護をテーマに、金沢美術工芸大学の学生の皆さんとともに3つの作品を制作しました。県内におけるCMの放映やメイキングムービーの制作なども行われました。
In Ishikawa Prefecture, "chart project for SDGs in ISHIKAWA" was co-sponsored with TV Kanazawa and NIPPON AGENCY.
In Komatsu City, we created a three-dimensional work "SAND GRAPH" with Kenji Fujii, using a graph showing the transition of maximum temperatures as a motif. In Suzu City, three works were created with students of Kanazawa College of Art under the themes of tourism, society, and nature conservation, and a making-of movie was shown on a special website.

WEB SITE
chart project®のWEBサイトでは、上記で紹介したプロジェクトについての詳細や、作品がご覧いただけます。
You can find more details about the projects mentioned above and their works on the chart project® website.
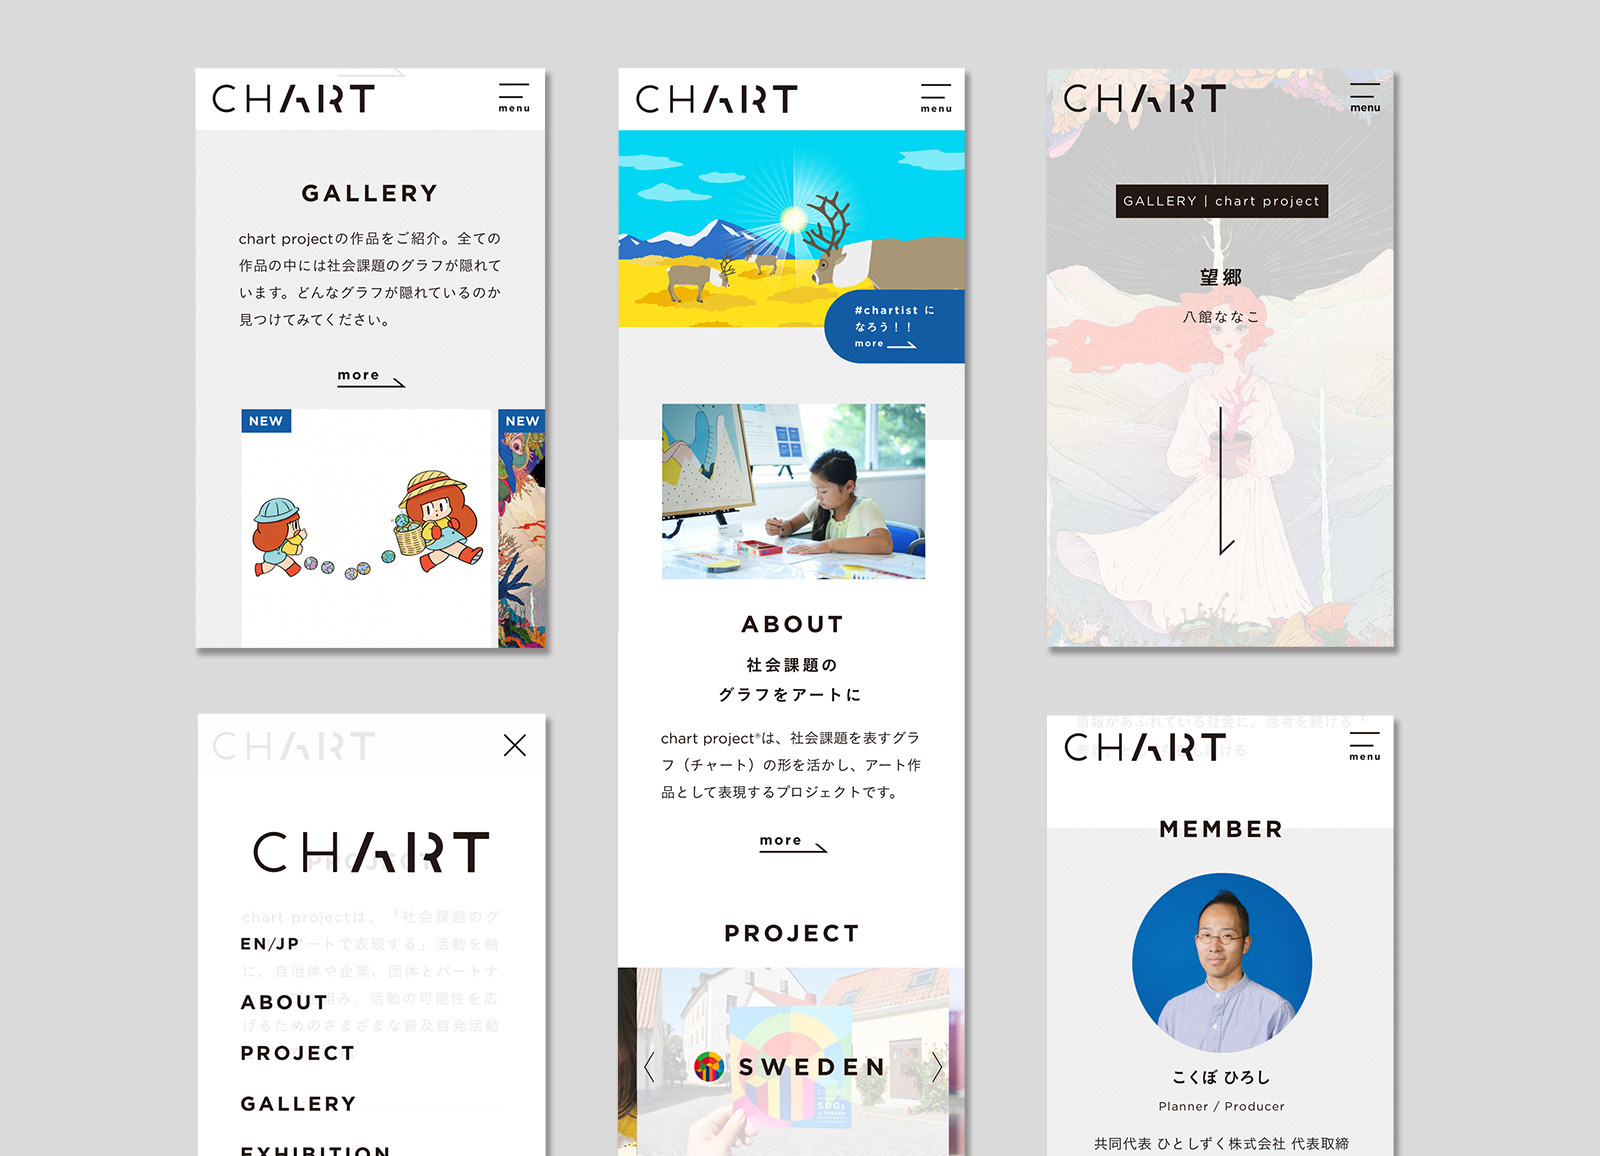
Creative Direction, Art Direction, Graphic design : Masaomi Fujita / tegusu Inc.
Graphic Design, Web design : Yu Kuramoto / tegusu Inc.
Graphic Design, Web design : Yu Kuramoto / tegusu Inc.
Photography : Hiroyuki Horigome
--------------------
Originator, Producer, Planner, PR:Hiroshi Kokubo / Hitoshizuku Inc.
--------------------
Check out our latest project :
Thank you for watching.